Resources
Work that was actually
done, not described.
Sol Gravitas™ publishes a document only when the research behind it has been carried out and can be repeated by the reader. Every file here opens directly, with no form and no email.
Data reports
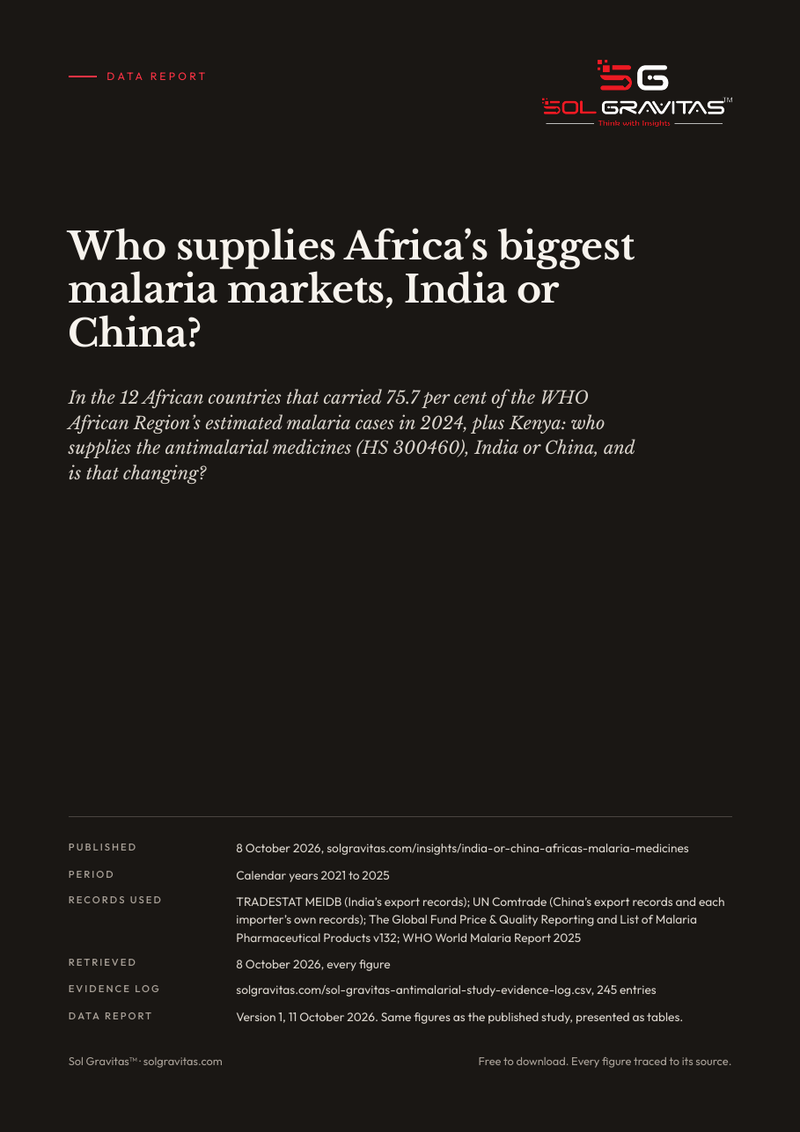
The figures behind the study Who Supplies Africa’s Biggest Malaria Markets, India or China?, presented as tables rather than as an article: the exporters’ records, the importers’ records and Global Fund purchases by product, country and maker, for 2021 to 2025.
Every table carries its own source and retrieval date. The method, the checks that were run and the limits of the records are set out in full. It is what a commissioned Sector Brief looks like, built on public records and published free.
India’s and China’s exports of HS 300460 to each of the 13 countries, by year, from each exporter’s own record.
Each importing country’s own record, the ten country-years where the two records disagree, and the eight-country series that tracks India’s share.
Global Fund purchases by product, by year and by country, with each maker matched to its listed factory country.
Ten findings as plain statements, the method, and nine stated limits.
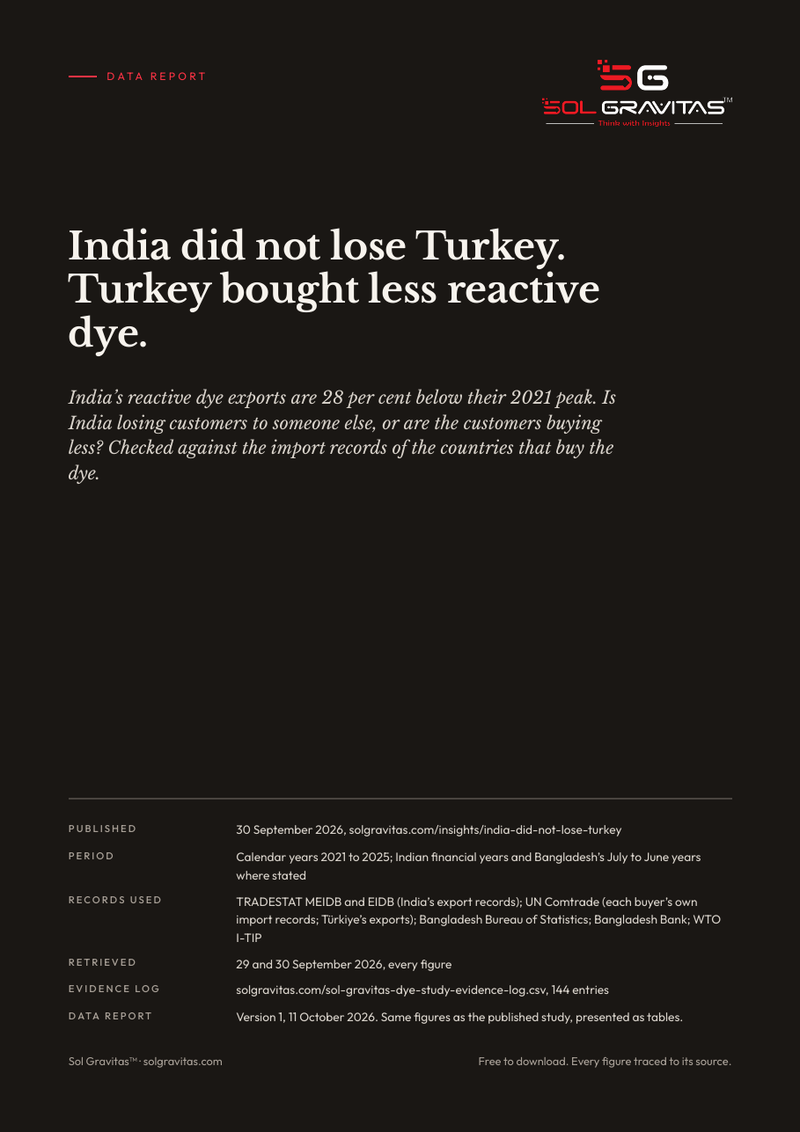
The figures behind the study India Did Not Lose Turkey. Turkey Bought Less Reactive Dye., presented as tables: India’s export records, Turkey’s and Bangladesh’s own import records, the buyer-side test for fifteen markets, and the published claims tested against the record.
Every table carries its own source and retrieval date. The method, the checks that were run and the limits of the records are set out in full. It is what a commissioned Sector Brief looks like, built on public records and published free.
India’s reactive dye exports by year and by line of HS 3204, from TRADESTAT.
Turkey by Turkey’s own records: value, weight, price per kilogram, and the two countries’ records side by side with the year that was excluded.
Bangladesh by Bangladesh’s own records, converted at Bangladesh Bank’s rate, with the supplier-by-supplier test that explains why no dollar value is confirmed.
The buyer-side test for every other market, showing which passed and which were dropped, and why.
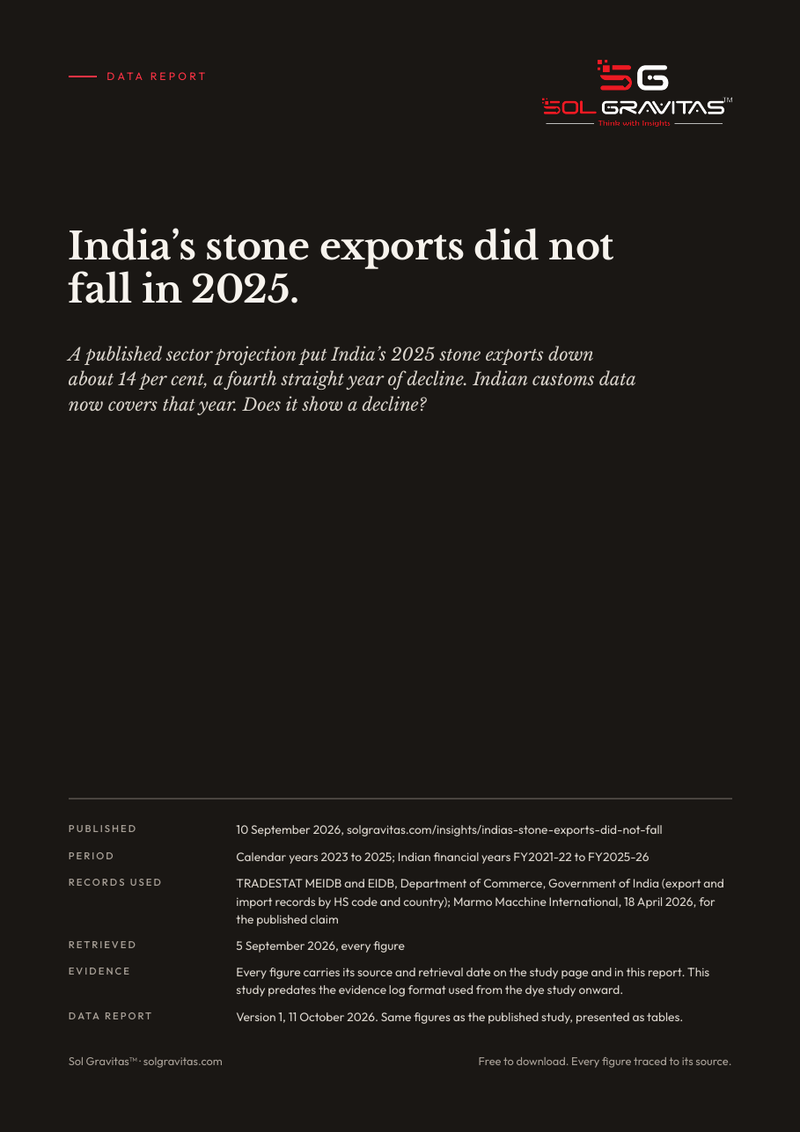
The figures behind the study India’s Stone Exports Did Not Fall in 2025, presented as tables: worked stone by year and by destination, the wider baskets on the financial year, the published projection set against the record, and the machinery side.
Every table carries its own source and retrieval date. The method, the checks that were run and the limits of the records are set out in full. It is what a commissioned Sector Brief looks like, built on public records and published free.
Worked stone, HS 6802, calendar 2023 to 2025, and the four-code basket on the Indian financial year.
The published claim, line by line, against the customs record for the same twelve months.
Where the volume went: the United States against Vietnam, the United Kingdom and Poland.
Italy’s share of India’s stone-machinery imports, the base effect behind the headline percentage, and the finding that was dropped.
Owner’s brief
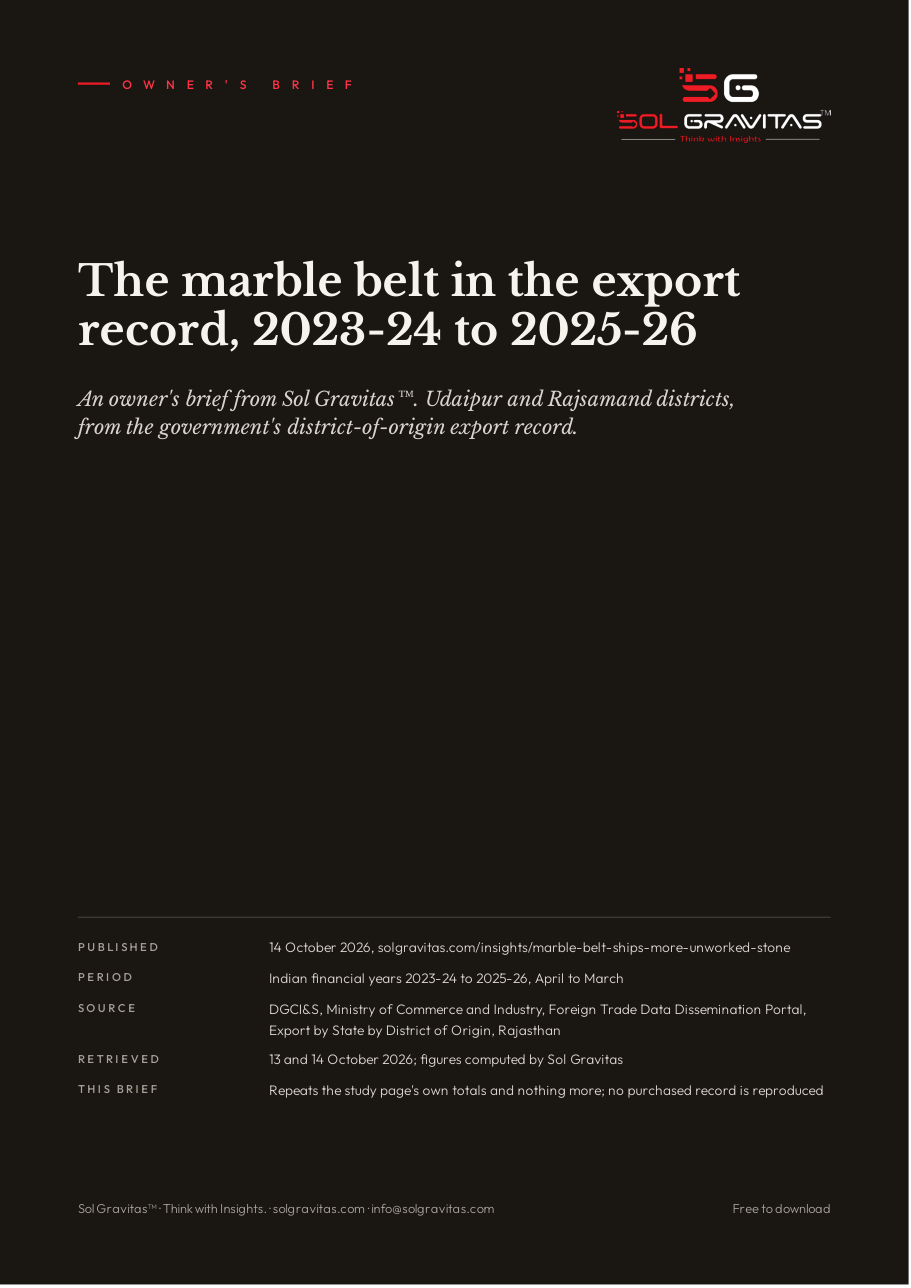
A short brief for owners in the Udaipur and Rajsamand belt, from the study The marble belt now ships more unworked stone than finished stone. It repeats the study page’s own totals and nothing more; no purchased record is reproduced.
Finished stone exports fell year on year, from Rs 377 crore in 2023-24 to Rs 308 crore in 2025-26, down 18 per cent.
Unworked stone, mostly blocks and plain-sawn slabs, roughly doubled, from Rs 173 crore to Rs 350 crore.
Artificial stone (customs heading 6810) rose 36 per cent in 2024-25 and fell 42 per cent in 2025-26, in both districts.
Three things to check in your own records, and the questions Sol Gravitas can answer for one unit.
Research note
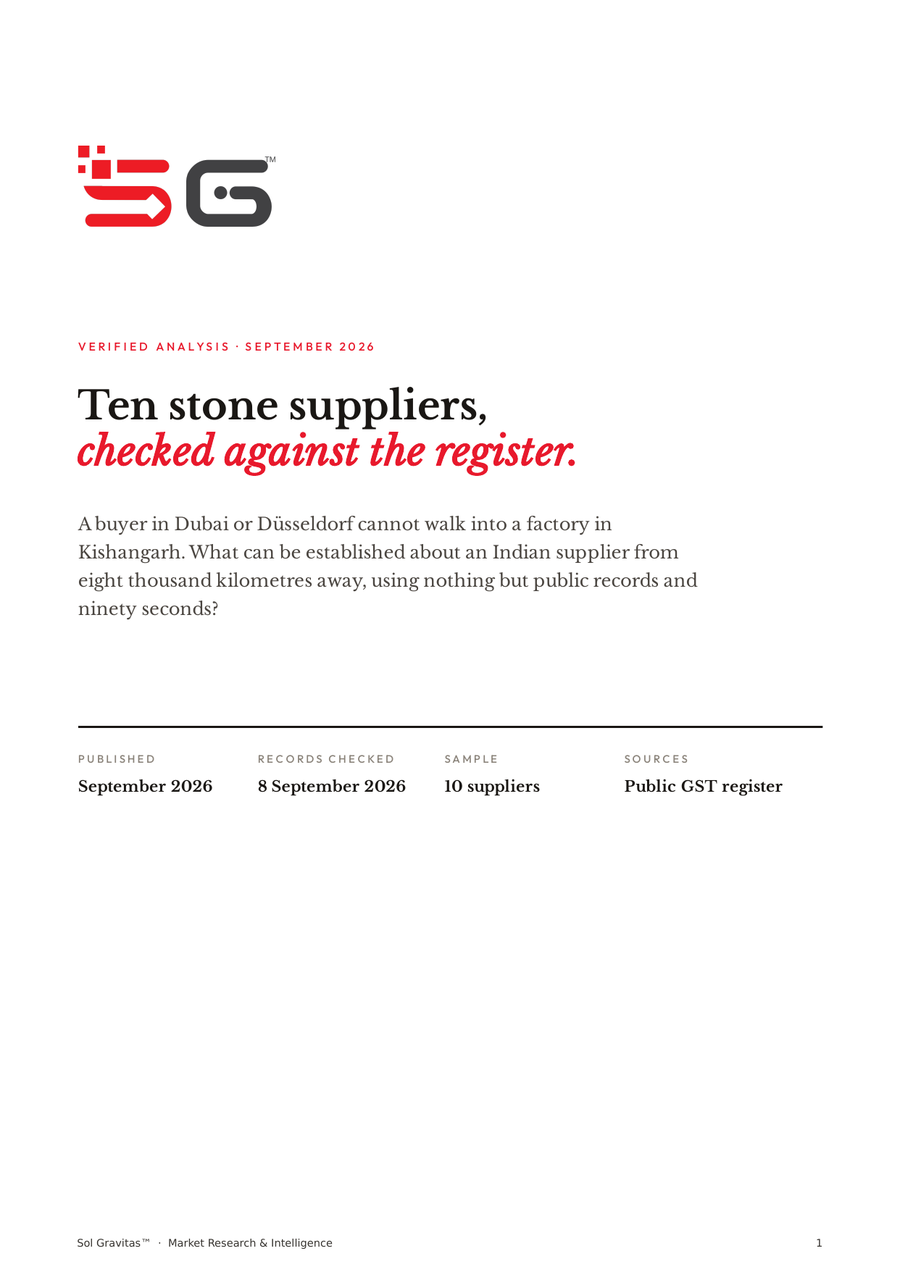
A buyer in Dubai or Düsseldorf cannot walk into a factory in Kishangarh. Sol Gravitas took ten Indian stone suppliers advertising on an open trade directory and checked each one against India's public tax register, to establish what a foreign buyer can actually verify from eight thousand kilometres away, and what each field really means once they find it.
No supplier is named. None was found to be fraudulent. The useful findings turned out to be structural rather than scandalous.
How to read the entity type (company, partnership or one individual) directly off a GSTIN, before running any search. Verified against ten records out of ten.
Why a platform verification badge and a tax register can disagree, and what that gap costs a buyer about to transfer money.
Which registration fields are reliable, which are not, and one field that misleads even when a company's own legal name contradicts it.
The full method, so any reader can repeat the checks on their own suppliers in about ninety seconds each.
Evidence logs
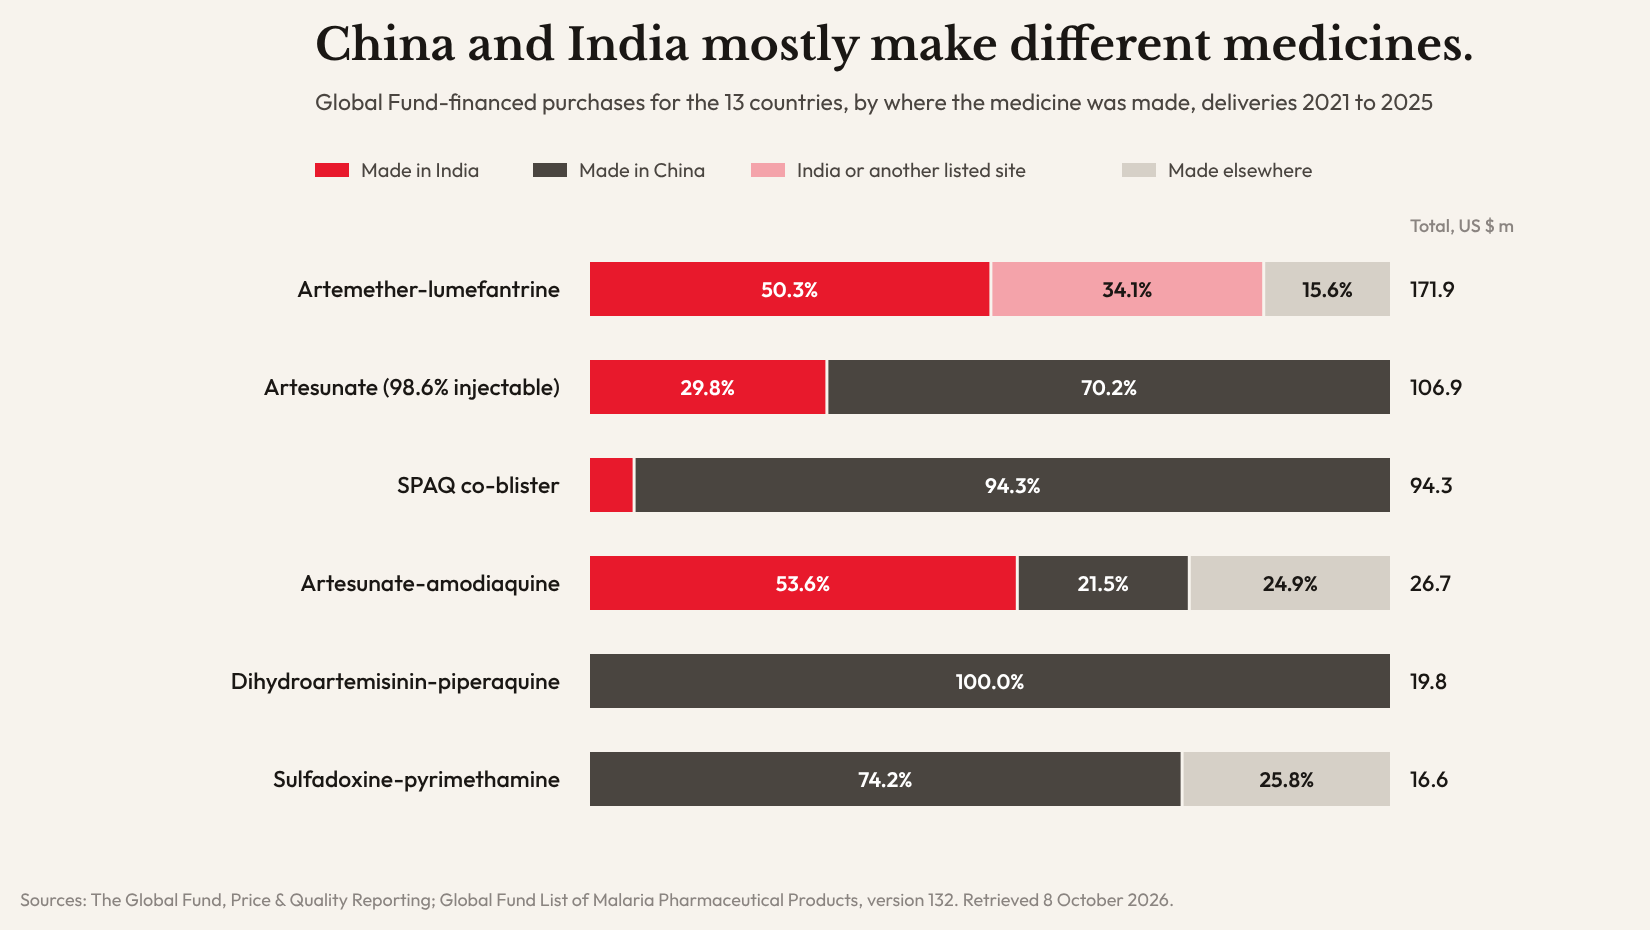
The full evidence behind the study Who Supplies Africa’s Biggest Malaria Markets, India or China? Every figure in the article is listed with the official source it came from, the query used to retrieve it, the date it was retrieved, and how it was checked.
Each figure is marked where a separate check recomputed it, and where it was read again by hand from the live source. Anyone can open it in a spreadsheet and repeat the work.
India’s export figures from the Department of Commerce, and China’s from its own reports to UN Comtrade.
Each importing country’s own records from UN Comtrade, set against the exporters’ records.
Global Fund purchases by product and maker, with each maker matched to its factory country from the Global Fund’s list of approved sites.
Every figure worked out from other figures, with the formula used.
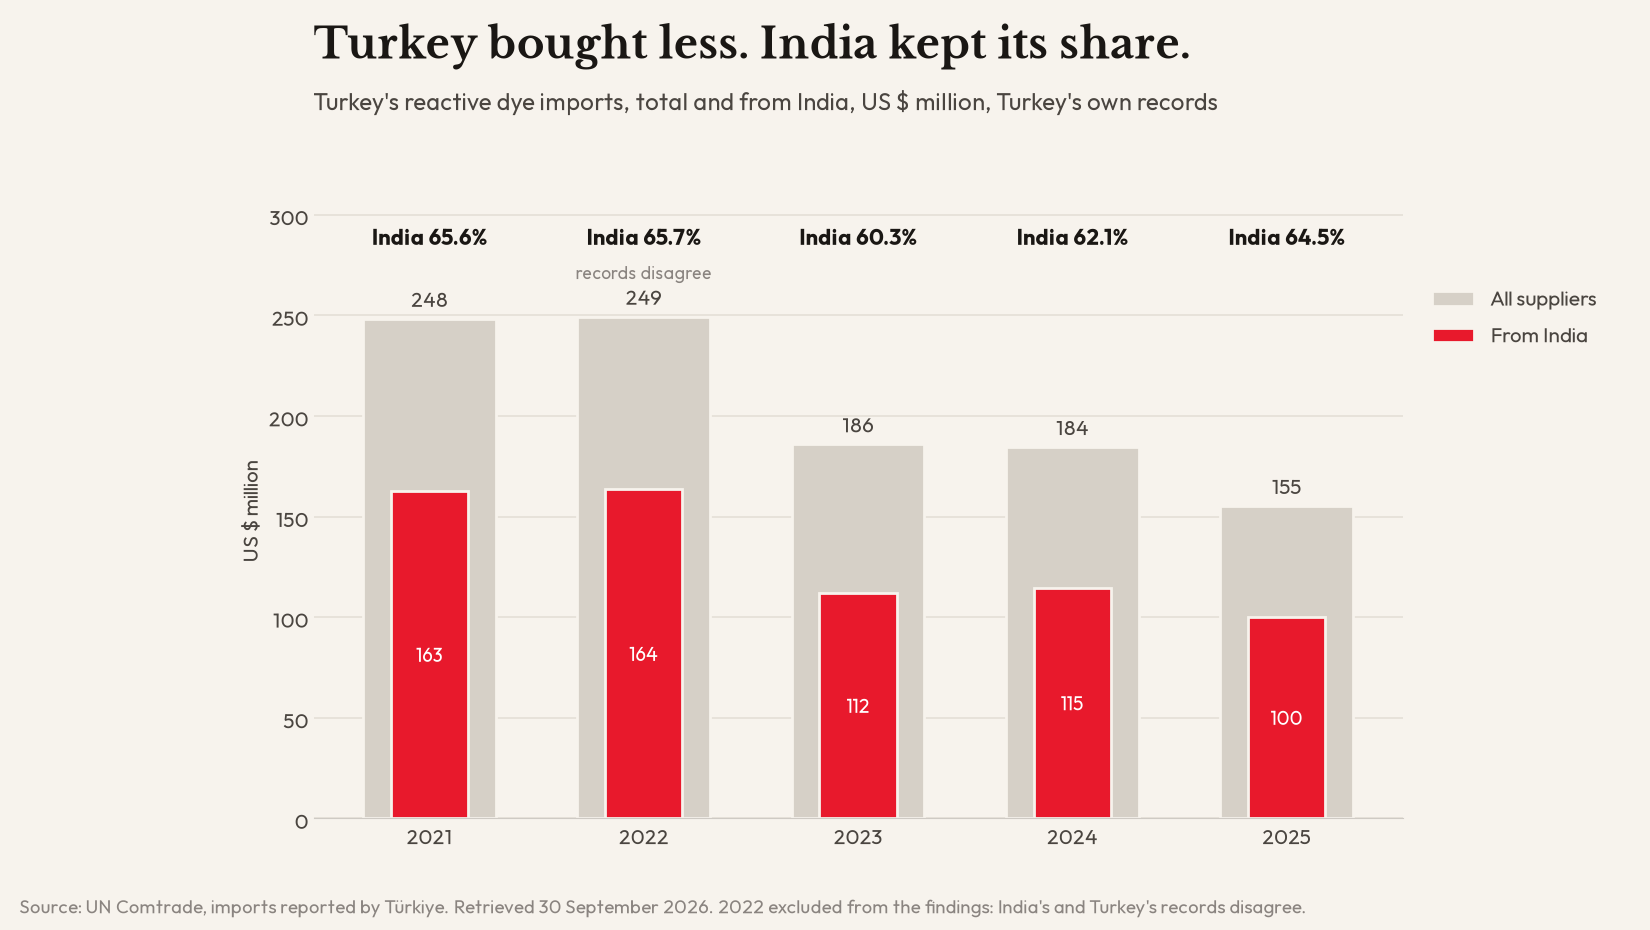
The full evidence behind the study India Did Not Lose Turkey. Turkey Bought Less Reactive Dye. Every figure in the article is listed with the official source it came from, the query used to retrieve it, the date it was retrieved, and the second record it was checked against.
The findings that failed the check are in it too, with the reason each was dropped. Anyone can open it in a spreadsheet and repeat the work.
India’s export figures from the Department of Commerce, set against each buying country’s own import records from UN Comtrade.
Bangladesh’s own figures from its statistics bureau, with the Bangladesh Bank exchange rates used to convert them.
The difference between the two records for every market tested, and whether it passed or was dropped.
The published figures that were tested, and the database error that was found and set aside.
On this library
Published on purpose,
and only when checked.
Most resource libraries exist to fill a content calendar. Templates nobody opens, frameworks assembled from other people's thinking, guides that summarise a government website without adding to it.
Sol Gravitas publishes only what it has carried out itself, with the method stated so the reader can check the working. That produces fewer documents, more slowly. It also means anything found here was true when it was published and can be tested by anyone who doubts it.
If there is a specific question a document like this would answer for a decision you are facing, write to info@solgravitas.com and describe it. Sol Gravitas will say honestly whether it is something worth researching properly.