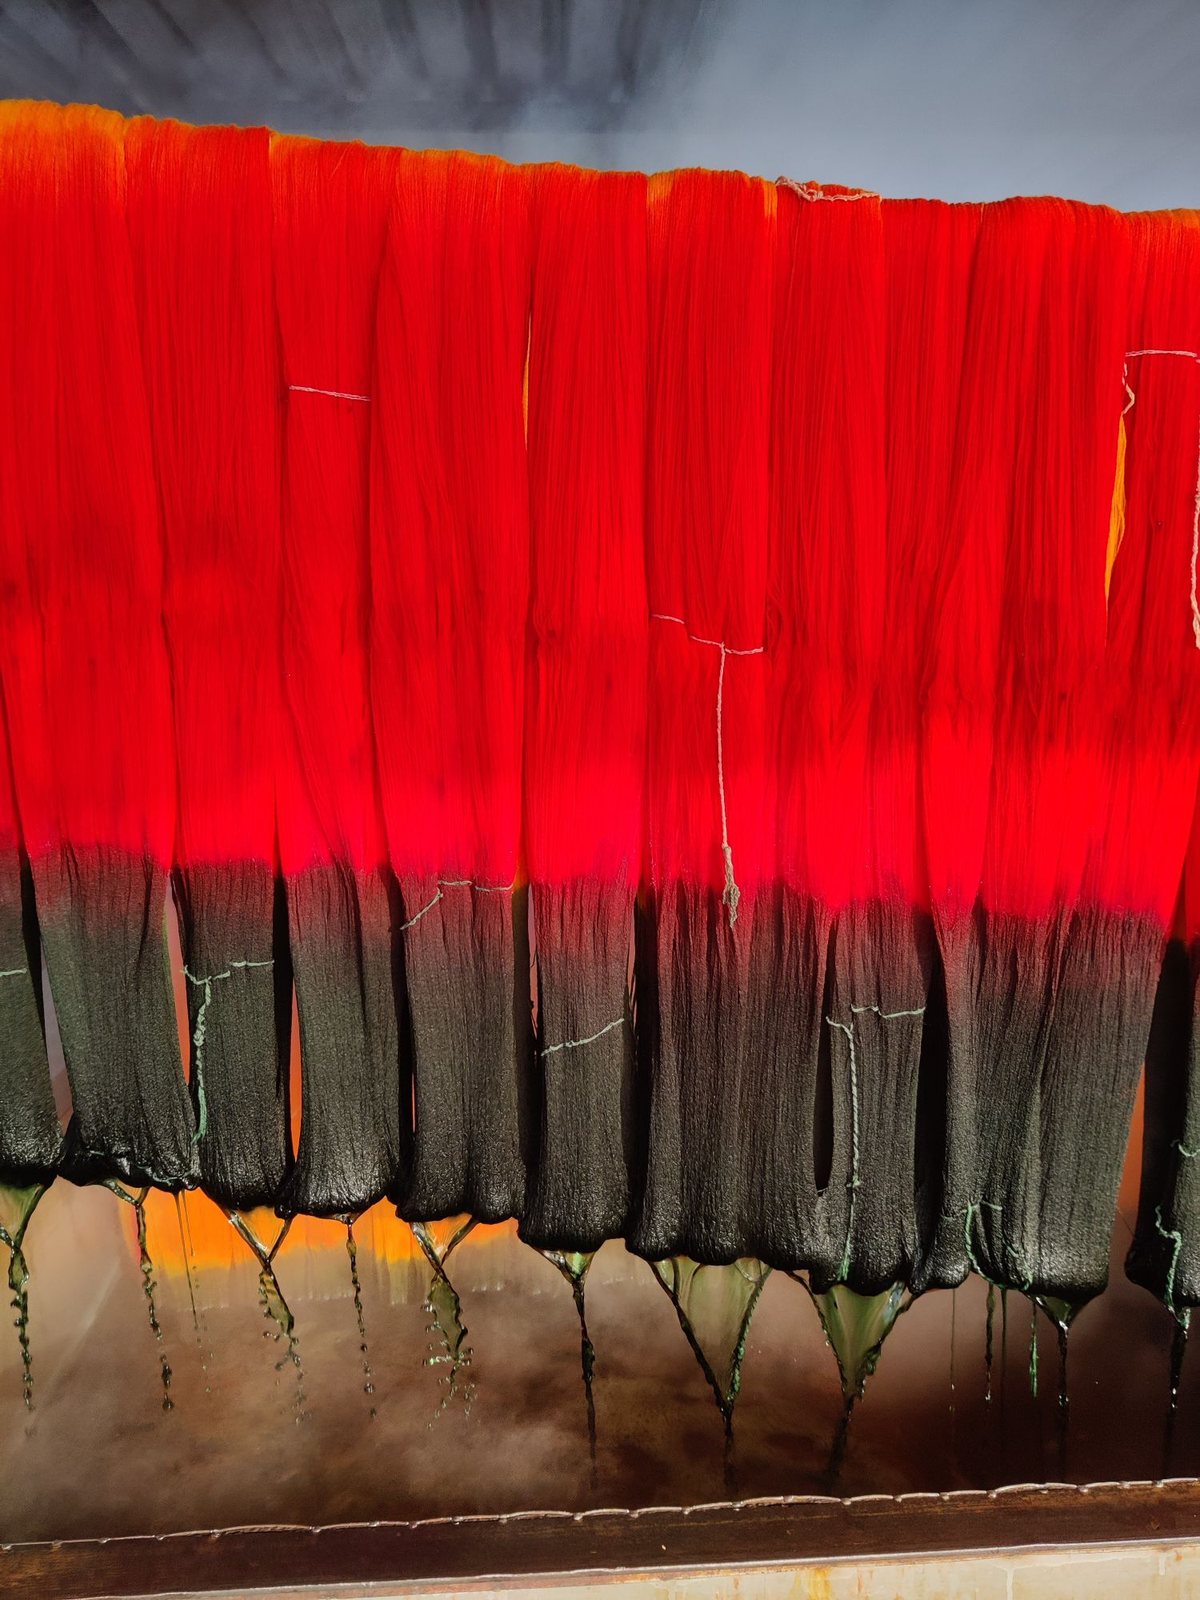
Reactive dyes are mainly used on cotton, and they are India’s largest dye export. For a manufacturer, a falling export total raises an obvious question: is India losing customers to someone else, or are the customers buying less?
The two call for different decisions. A lost customer can be won back from a competitor. A shrinking customer cannot, and the sales effort is better spent where demand is growing or where a competitor is exposed.
Sol Gravitas checked India’s own export figures against the import records of the countries that buy the dye. For India’s two largest markets, Turkey and Bangladesh, the buyers’ own records tell a clearer story than the export total does.
How this was checked
- Primary source
- Department of Commerce, Government of India: TRADESTAT. EIDB (Indian financial years) and MEIDB (months and calendar years).
- Buyer-side
- UN Comtrade (each country’s own official figures, as submitted to the UN Statistics Division). Bangladesh Bureau of Statistics, Foreign Trade Statistics of Bangladesh 2023-24 and 2024-25. Bangladesh Bank, Economic Trends, September 2026, for Taka to dollar rates. World Trade Organization, Integrated Trade Intelligence Portal (I-TIP), for trade measures.
- Codes
- HS 320416 (reactive dyes and preparations based on them). HS 3204 (all synthetic organic colouring matter) as the wider basket.
- Query path
- TRADESTAT: Exports → Commodity-wise all Countries, and Commodity-wise, values in US$ million. UN Comtrade: Goods, Annual, HS, Imports and Exports, by reporting country and partner.
- Retrieved
- 29 and 30 September 2026. EIDB last updated 7 August 2026. MEIDB last updated 16 September 2026, revised final to March 2026, final to July 2026.
- The test
- A finding about a market ships only if the buyer’s own records move in the same direction as India’s, and the two differ by no more than 25 per cent. Import values include freight and insurance, so the buyer’s figure is expected to be somewhat higher. The test and the limit were set before any data was pulled.
against
What the export figures show
India’s reactive dye exports peaked at $773.74 million in 2021, fell to $532.25 million in 2023, and stood at $556.37 million in 2025: 28 per cent below the peak, but 4.5 per cent above 2023. The first seven months of 2026 are flat on the same months of 2025, up 0.8 per cent.
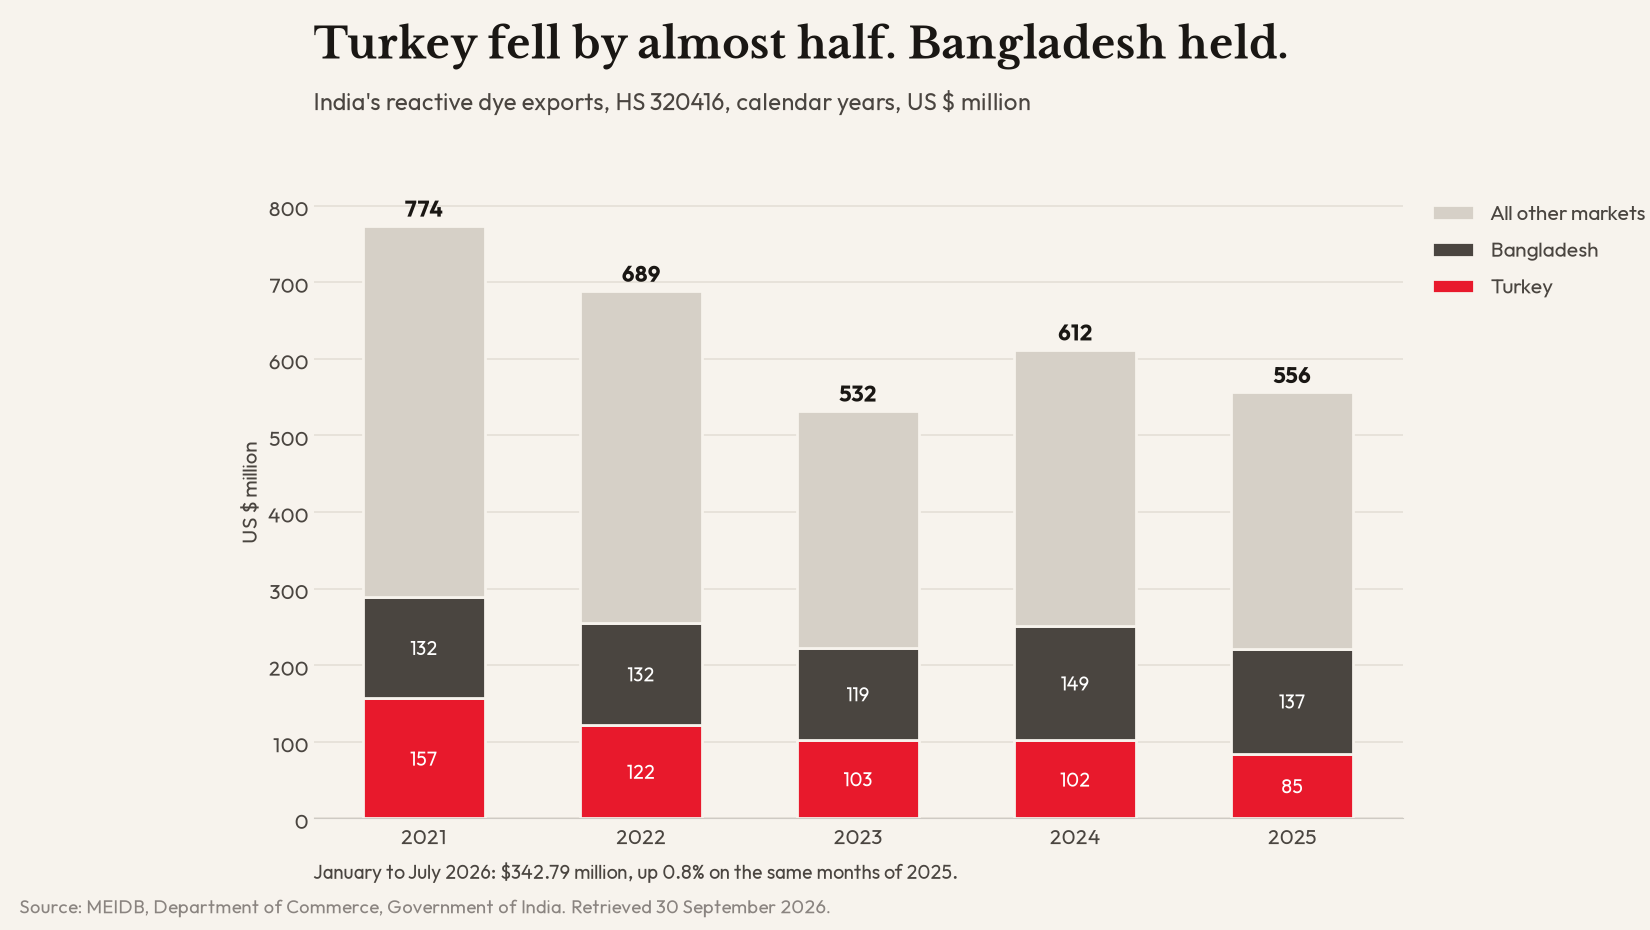
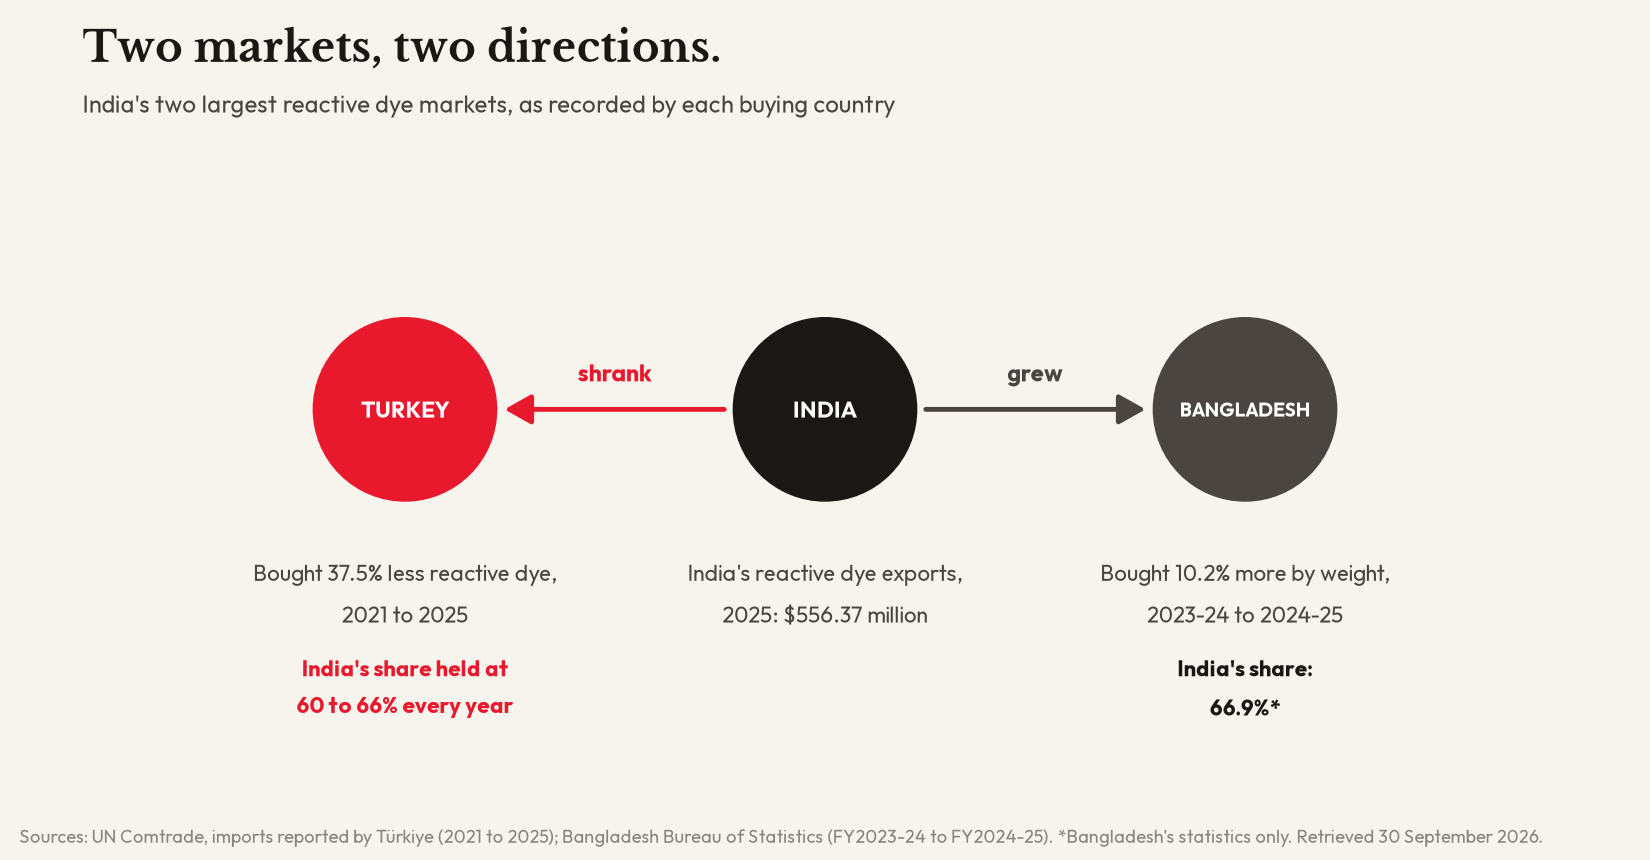
Two markets dominate. In 2025 Bangladesh took 24.6 per cent of India’s reactive dye exports and Turkey 15.2 per cent. They moved in opposite directions: Turkey fell by almost half, while Bangladesh held up. Turkey’s fall of $72.04 million is a third of the entire fall since 2021.
Reactive dyes are India’s largest dye export, though not its largest line in the wider basket: in the financial year 2025-26, pigments earned $747.31 million against $535.92 million for reactive dyes.
Turkey bought less. India still sold it most of what it bought.
Turkey: the customer bought less
Read on its own, India’s 46 per cent fall in sales to Turkey looks like a lost customer. Turkey’s own import records say otherwise.
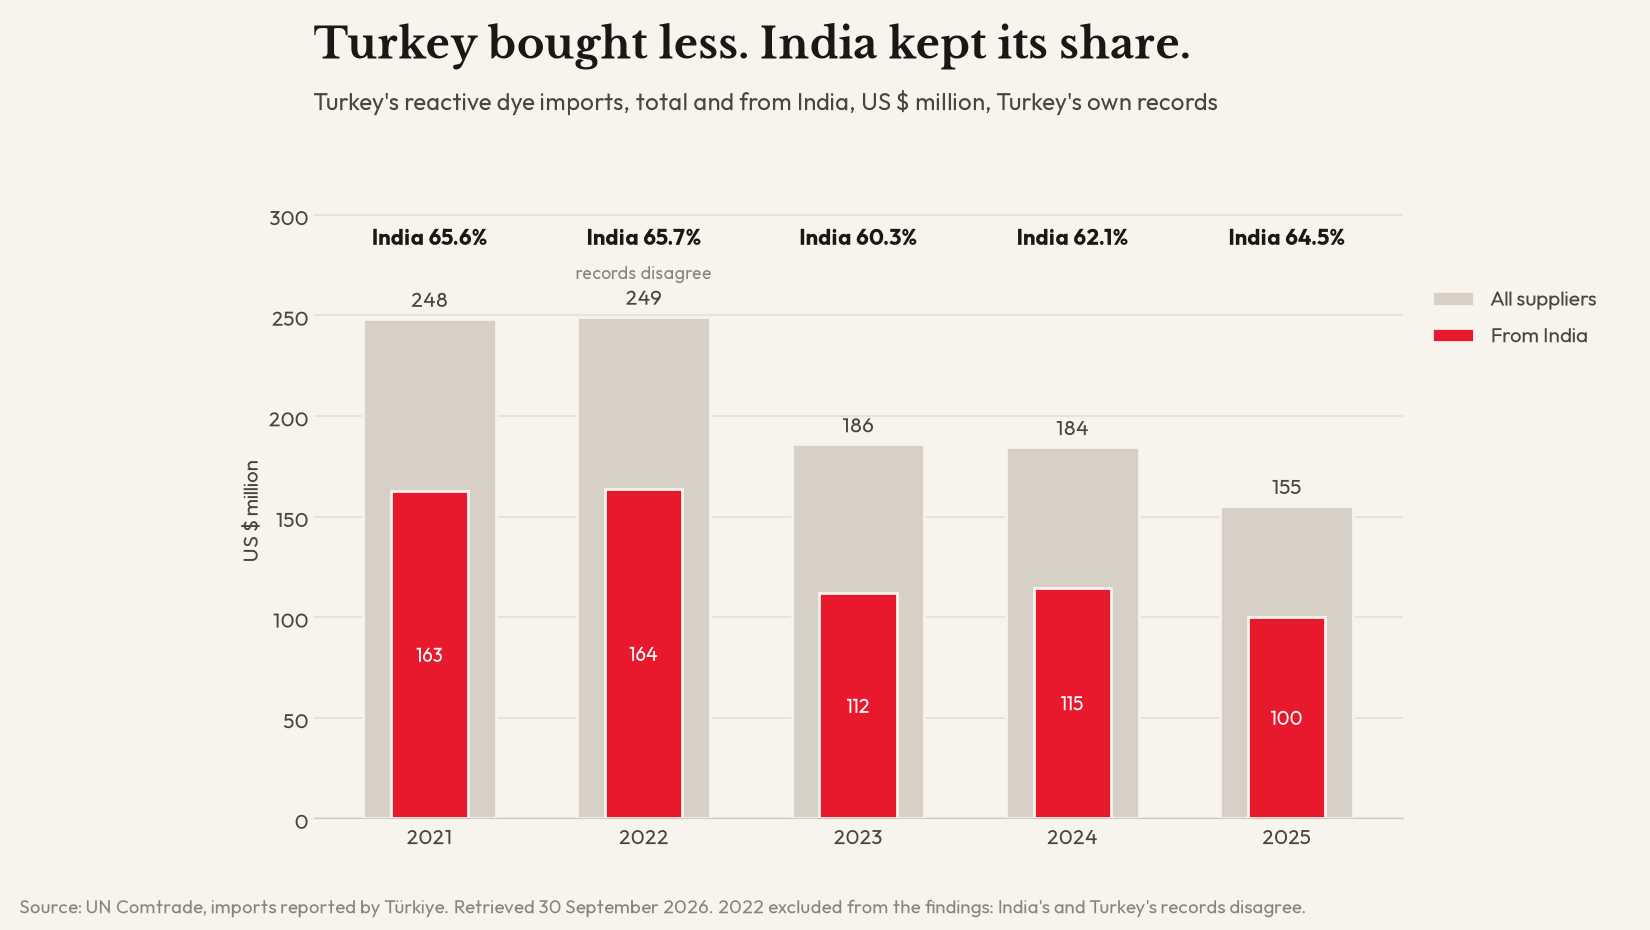
Turkey’s total reactive dye imports fell 37.5 per cent between 2021 and 2025. By value, India’s share of them stayed between 60 and 66 per cent in every year, and was almost exactly where it started. China, the next supplier, held between 10 and 15 per cent, and its share fell in 2025 while India’s rose. In dollars, this is not the pattern of a customer turning away from India. The weight figures below add one qualification.
The two countries’ records agree:
| Year | Turkey’s record of purchases from India | India’s record of sales to Turkey | Difference between the two records |
|---|---|---|---|
| 2021 | $162.75m | $156.58m | +3.9% |
| 2022 | $163.65m | $122.18m | +33.9%, excluded |
| 2023 | $112.05m | $102.77m | +9.0% |
| 2024 | $114.65m | $101.80m | +12.6% |
| 2025 | $100.15m | $84.54m | +18.5% |
Sources: UN Comtrade, imports reported by Türkiye; MEIDB, Department of Commerce, Government of India. Retrieved 29 and 30 September 2026.
In 2022 the two records move in opposite directions and differ by 33.9 per cent, so nothing in this study rests on that year for Turkey. Every other year passes the test.
Turkey bought less dye, not cheaper dye. Measured by weight, Turkey’s reactive dye imports fell 30.9 per cent, while the average price it paid fell only 9.5 per cent. The price it paid for Indian dye barely moved. By weight, Turkey’s record of what it bought from India fell 36.4 per cent from 2021 to 2025, and India’s record of what it sent to Turkey fell 37.1 per cent between the financial years 2021-22 and 2025-26. The two countries agree on the fall.
By weight, India gave up some ground. India’s share of what Turkey bought fell from 77.6 per cent of the weight in 2021 to 71.5 per cent in 2025. Turkey’s purchases from India fell 36.4 per cent by weight; its purchases from all other suppliers together fell 12.2 per cent. India’s share by value held because Turkey paid less per kilogram for other suppliers’ dye, about 27 per cent less on average, with Chinese dye falling from $7.67 to $5.53 a kilogram. India kept its place in what Turkey spent, and gave up some of its place in what Turkey bought. The records do not show why.
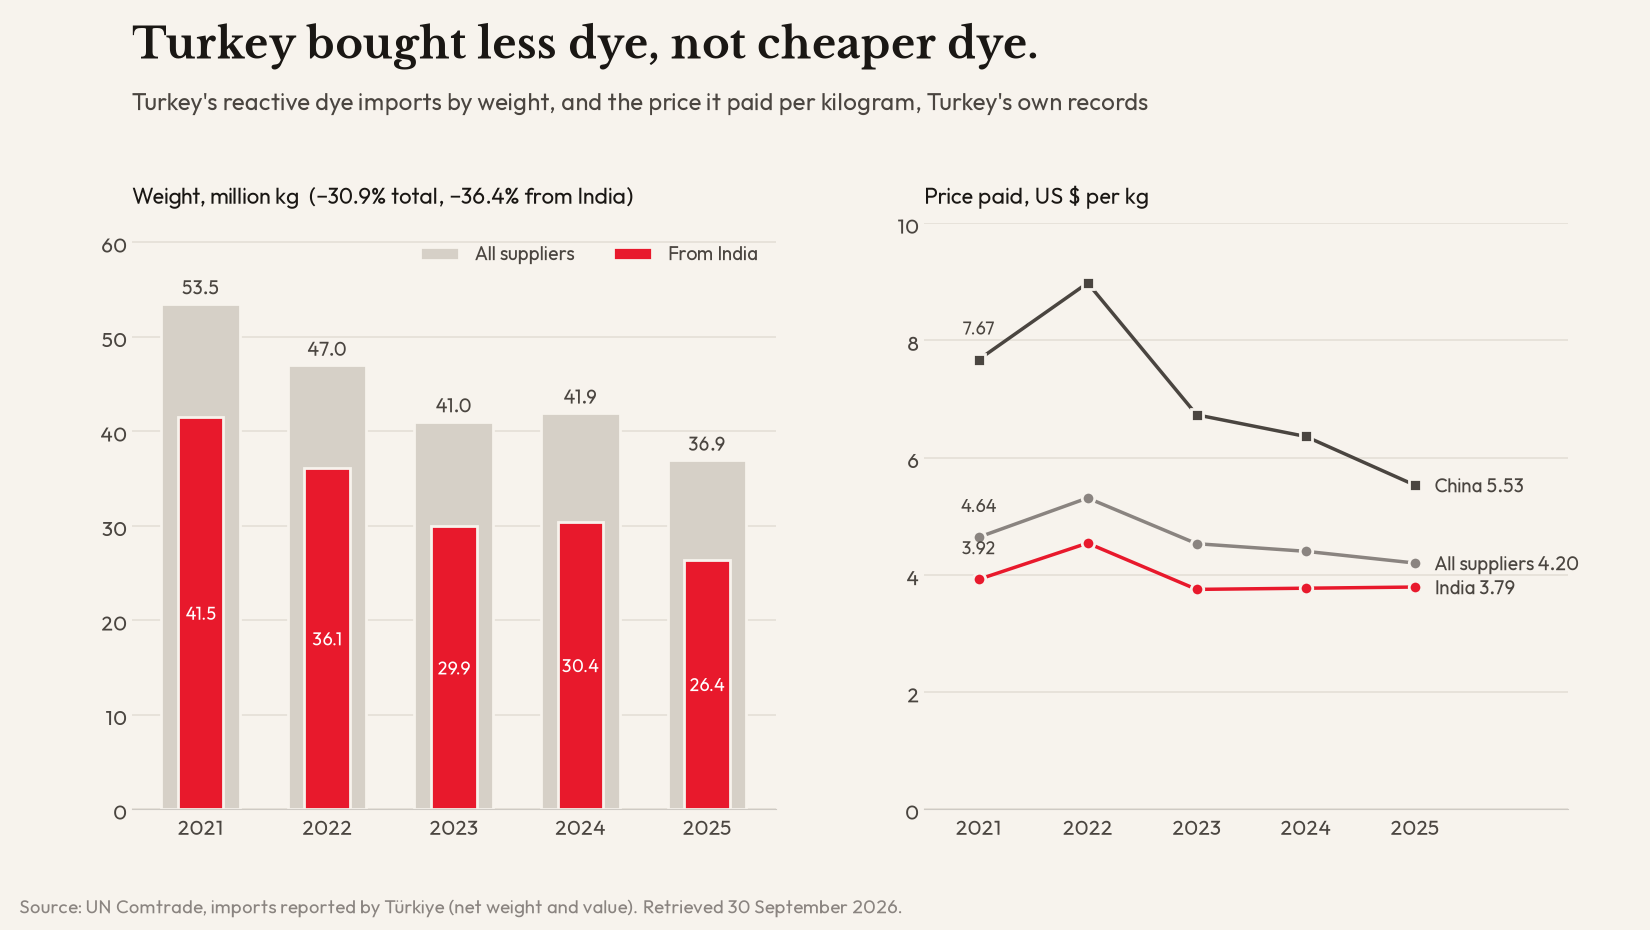
Why Turkey bought less is not settled by the records. Two checks narrow it down. Turkey’s own exports of cotton, knitted fabric and clothing fell 10.7 per cent between 2021 and 2025, and knitted fabric alone 24.4 per cent, which is consistent with weaker demand for dye but much smaller than the 30.9 per cent fall in dye volume. And a search of the WTO’s trade-measures register found no Turkish measure covering reactive dyes. Neither accounts for the whole fall, and this study does not claim a cause.
India’s figures show Turkey recovering in 2026, up 30.3 per cent in January to July. Turkey’s own figures for 2026 could not be obtained, so this rests on India’s records alone and is not treated as a finding.
Bangladesh: the larger market grew
Bangladesh does not report to UN Comtrade, so its figures come from its own statistics bureau, which reports years running July to June.
Bangladesh’s reactive dye imports rose 10.2 per cent by weight between 2023-24 and 2024-25, and 6.6 per cent in dollars, to $307.4 million. India’s own records show its sales to Bangladesh rising over a similar period. In 2024-25, by Bangladesh’s record, India supplied 66.9 per cent of those imports, South Korea 10.5 per cent and China 10.3 per cent. That share comes from Bangladesh’s statistics alone and has no second source.
The two countries agree on how much dye crossed the border: within 8.1 per cent by weight. They do not agree on what it was worth. Bangladesh records the dye from India at about $205.7 million for July 2024 to June 2025, against $148.89 million in India’s records, a gap of 38.1 per cent, beyond the limit this study set.
To test whether Bangladesh’s records simply run higher for every supplier, Sol Gravitas compared Bangladesh’s record of imports from each supplier with that supplier’s own record of exports to Bangladesh.
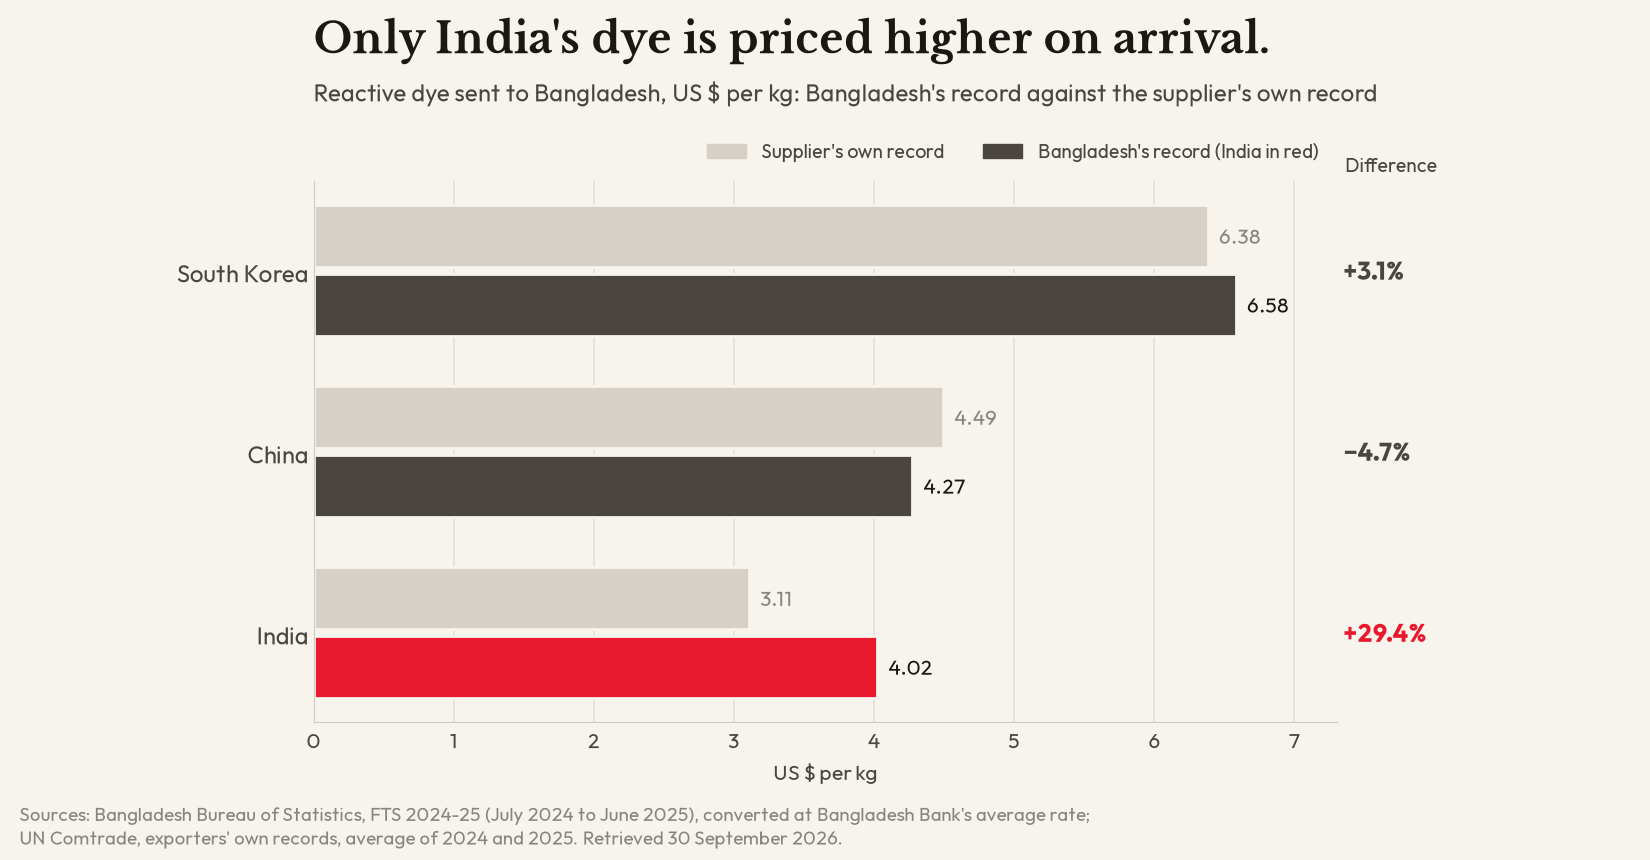
For South Korea, the two records agree within 4.0 per cent on value and 0.8 per cent on weight, so Bangladesh’s figures, and the conversion used here, can match a supplier’s own record closely. For India they do not: Bangladesh records Indian dye at 29.4 per cent more per kilogram than India does. For China, and for Thailand, the records differ mainly on weight rather than price. No official source explains the difference for India, and this study states no dollar value for India’s sales to Bangladesh as confirmed.
Where India’s share is small
Among India’s other markets, those whose own records passed the same test show where India already dominates and where a competitor does.
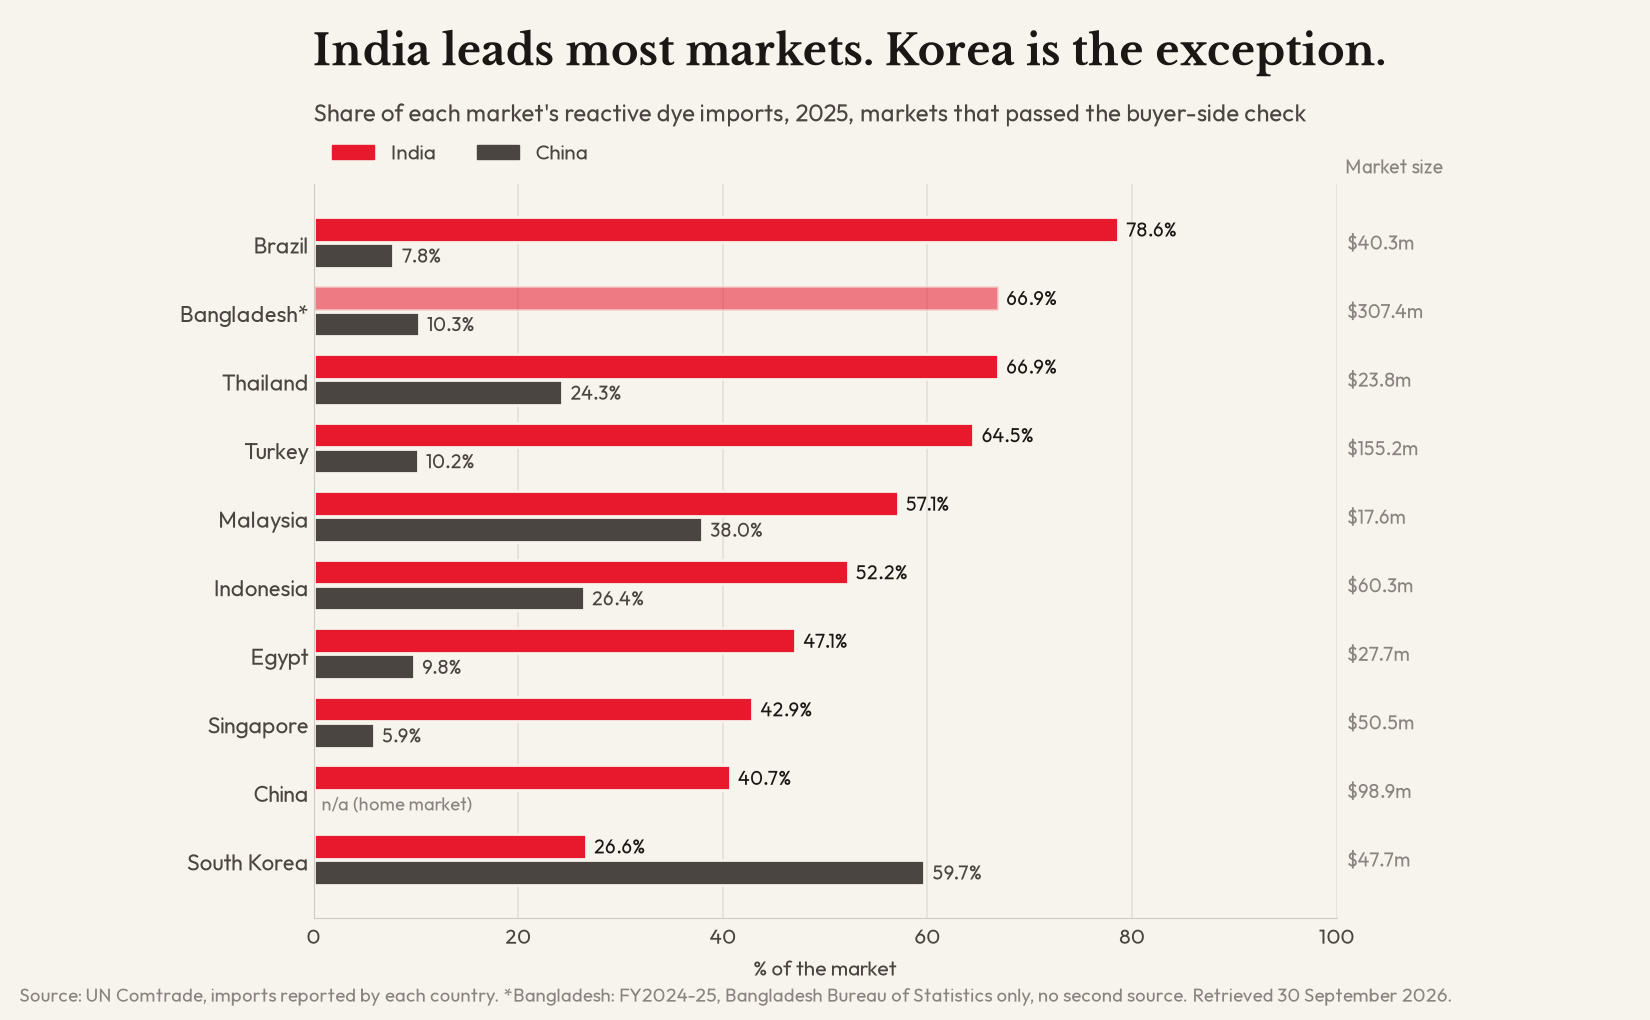
South Korea is the one market in this group where China supplies far more than India. It is also a shrinking market, down 41.4 per cent since 2021 to $47.66 million. India’s sales there nevertheless rose by about a third in 2025, on both countries’ records. In China’s own market, India supplied 40.7 per cent of reactive dye imports in 2025.
What has already been published
The most widely quoted figures for this product come from the Observatory of Economic Complexity (OEC), which publishes its own estimates rather than a government’s record. For most countries they sit close to the official records: India’s 2024 exports within 5.4 per cent, and the imports of Turkey, Brazil, Indonesia, Singapore, South Korea and China within about 4 per cent. Pakistan is the exception. OEC gives Pakistan’s 2024 imports as $110 million; Pakistan’s own record is $59.57 million, and reaches that level only in 2025, at $106.85 million. Sol Gravitas draws no conclusion about the reason. India’s chemical export council, CHEMEXCIL, reports dye exports within 0.1 per cent of the figures used here, drawn from the same government source.
What this means for an exporter
A manufacturer reading only the export total would see a product in decline. The buyers’ records show something more specific.
Turkey shrank, and India held most of its ground. India still supplies around two-thirds of the market by value and 71.5 per cent by weight, though its share by weight has slipped since 2021. More business there depends mainly on Turkey buying more. The slip by weight is worth watching, and these records do not show who gained it.
Bangladesh grew, and India appears to lead it. India’s largest market bought more in 2024-25 than the year before. India’s 66.9 per cent share comes from Bangladesh’s statistics alone, with no second source to confirm it.
The room to take business is where a competitor leads. Among markets that passed every check, South Korea is the clearest case: a small and shrinking market, but one where China supplies nearly 60 per cent, India just over a quarter, and India’s sales are rising. The opportunity there is share, not growth.
Pakistan is a large market with almost no Indian sales. Pakistan imported $106.85 million of reactive dye in 2025, by its own record, and almost none from India in any year from 2021 to 2025. This study did not examine why.
Sol Gravitas takes no position on what happens next. The figures describe what has already happened, and every one can be reproduced from the official sources named.
Evidence log. Every figure in this study, with its source, query path, retrieval date and the second record it was checked against, including the findings that were dropped.
Download the evidence log (CSV) →Limitations
Findings were dropped. Turkey’s 2022 figures are excluded because the two records move in opposite directions. Bangladesh’s dollar value is excluded because the two records differ by 38.1 per cent. Mexico, Italy, Germany, Switzerland, the United States, Portugal and Guatemala failed the buyer-side test in 2024 or 2025, on direction or by a gap above 25 per cent, and no finding rests on them.
A database error was found. In TRADESTAT’s EIDB, the Commodity-wise report for the financial year 2023-24 shows reactive dye exports of $1,119.18 million. The Commodity-wise all Countries report for the same code and year shows $559.59 million, exactly half. The same doubling appears in other lines for that year. No figure from that report for 2023-24 is used.
Some checks could not be made. Turkey’s statistics office (TÜİK) could not be queried, so the 2026 recovery in Turkey rests on India’s figures alone. The India-specific row of Bangladesh’s 2023-24 report could not be extracted, so the direction of India’s sales to Bangladesh rests on India’s records. Vietnam’s figures for 2024 and 2025 were not in UN Comtrade on the retrieval date. The WTO register covers anti-dumping and countervailing measures only to the first half of 2020.
Different years and values. India reports financial years (April to March) and calendar years; Bangladesh reports July to June. Import values include freight and insurance; export values do not. Bangladesh’s figures are converted at Bangladesh Bank’s period-average rate (Tk 111.06 per dollar for 2023-24 and Tk 120.82 for 2024-25, Table XX); its weighted interbank rate (Tk 122.85 for 2024-25, Table IB) would lower the dollar figures by about 1.7 per cent and changes no conclusion. Turkey’s textile figures are export values and do not cover production for its home market.
Leads were corrected. An earlier scan suggested reactive dyes were India’s largest line in HS 3204; pigments are larger. It also placed Pakistan’s $110 million of imports in 2024; Pakistan’s own record puts that level in 2025.
Sources not used. OEC figures are modelled estimates and are quoted only as published claims to be tested. Figures India reports to UN Comtrade and WITS come from the same source as TRADESTAT and are not counted as a second check. Published market-size estimates for India’s dye industry were not examined.
No causes are stated. Where no official source explains a movement, this study says so and does not offer one.
This study is general information, not business, investment or legal advice.
Updated 30 September 2026, the day of publication. Added India’s share of Turkey’s purchases by weight (77.6 per cent in 2021, 71.5 per cent in 2025), which fell further than its share by value, and changed the summary, pull quote and Turkey conclusion to match. Stated what the 37.1 per cent weight figure is compared against. Marked the Bangladesh share as resting on one source in the conclusions. Replaced the Pakistan conclusion, which gave no basis, with a neutral statement. Limited the China line to 2025. Corrected the publication date from October to September 2026. The new figures are in the evidence log.
Sol Gravitas will publish any correction provided by the Department of Commerce, the UN Statistics Division, the Bangladesh Bureau of Statistics or any other party, in full and without editing. Corrections and queries: info@solgravitas.com