On 18 April 2026, Marmo Macchine International — the magazine of the Italian stone and stone-technology association — published a country focus on India drawing on figures it attributes to the Confindustria Marmomacchine Studies Centre. It reported that in 2024 India was the world’s fourth-largest exporter of natural stone, with foreign sales of $1.7 billion, and that its stone exports had lost 16 per cent of their value over the preceding decade. For 2025 it carried a forecast: a fourth consecutive annual decline, down about 14 per cent, to roughly $1.45 billion.
India’s own customs data now covers that year. It does not show a decline.
This is not a correction of a reported result. The article describes the 2025 figure as a prediction, made before full-year data existed. Forecasts diverge from outcomes routinely and no one is at fault when they do. But it is the figure now circulating as the state of the Indian stone sector, and the customs data underneath it says something different and more interesting.
One qualification on sourcing. Sol Gravitas has worked from the magazine article, which is the version publicly available. The underlying Studies Centre document has not been located on the association’s own site and has not been consulted. Where the article’s wording and the Studies Centre’s wording may differ, the article is what is quoted here.
How this was checked
- Source
- Department of Commerce, Government of India — TRADESTAT. Two separate databases: EIDB, which reports Indian financial years, and MEIDB, which reports monthly and allows a calendar-year view.
- Codes
- Exports: 2506, 2514, 2515, 2516, 6801, 6802, 6803. Imports: 2515, 2516, 8464.
- Query path
- Exports → Commodity-wise all Countries, and Commodity × Country-wise, values in US$ million.
- Retrieved
- 5 September 2026. EIDB last updated 7 August 2026; MEIDB revised final to March 2026, final to June 2026.
- Comparison
- Confindustria figures are calendar years. All headline figures below are therefore drawn from MEIDB on a calendar basis, matching their period exactly.
What the export figures show
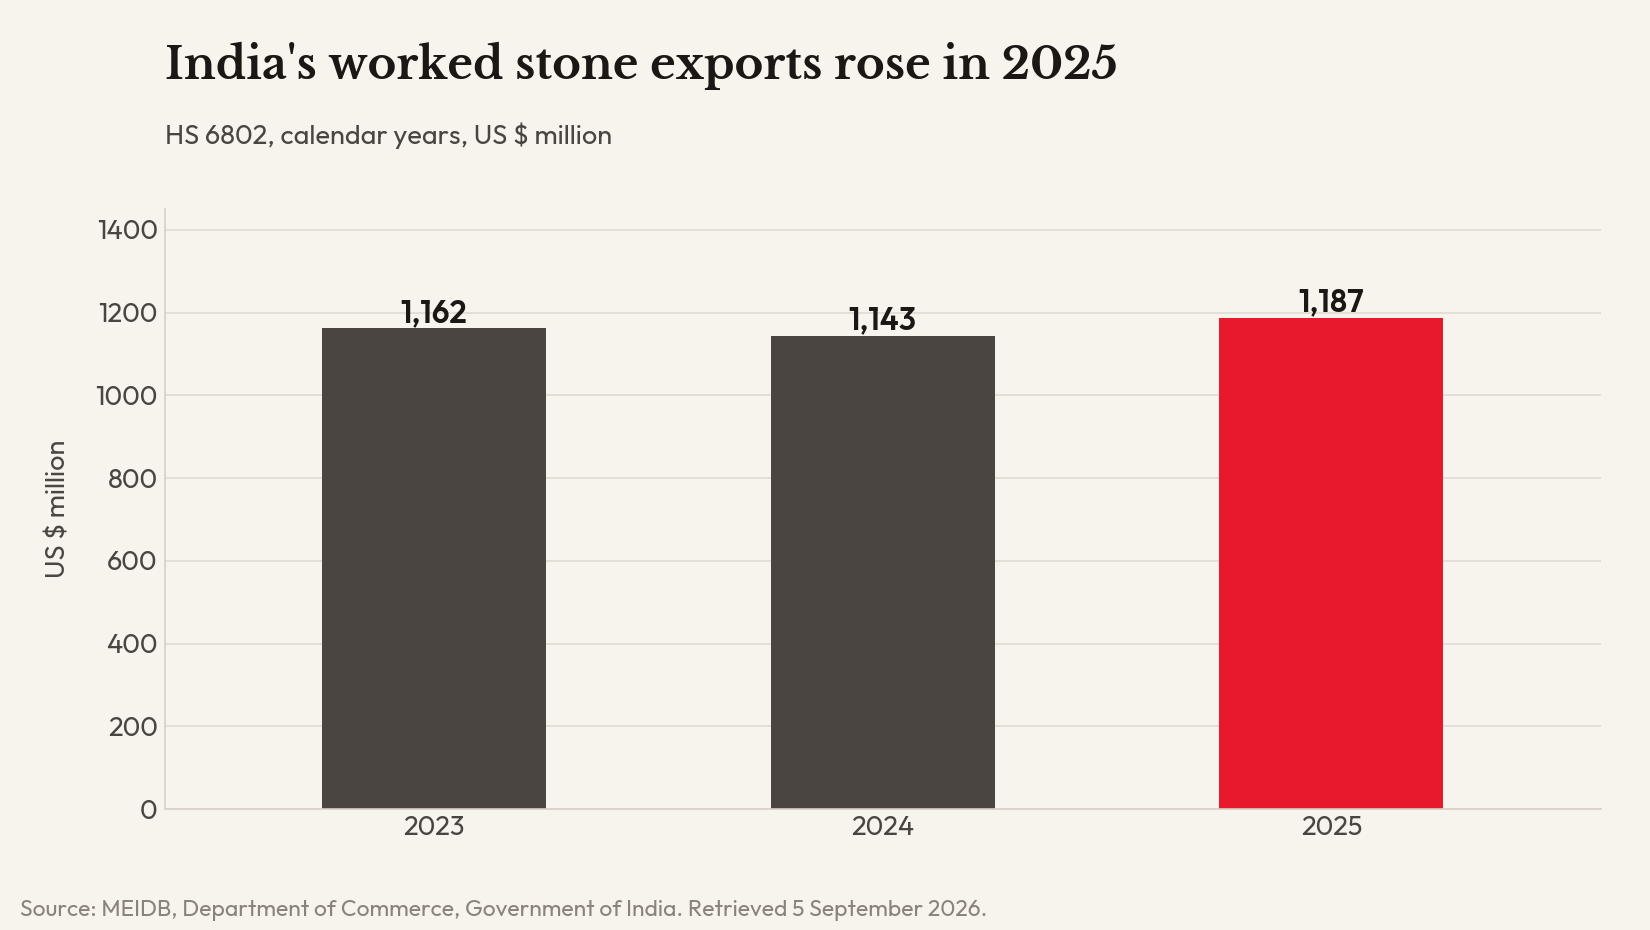
Worked stone, HS 6802, is the dominant line in India’s stone trade — by Confindustria’s own account finished and semi-finished products had risen to 68 per cent of India’s stone exports by 2024. On a calendar basis it stood at $1,162.01 million in 2023, $1,142.84 million in 2024, and $1,187.46 million in 2025. A dip of 1.65 per cent, then a rise of 3.90 per cent.
Widening the basket does not change the direction. Taking the four codes that cover raw and worked stone on the Indian financial year, exports were $1,783.40 million in 2023-24, $1,721.94 million in 2024-25 and $1,815.55 million in 2025-26 — down 3.45 per cent, then up 5.44 per cent. Adding slate moves the totals by under two per cent and the growth rates barely at all. Adding quartzite deepens the middle-year fall to 10.65 per cent, but the final year still rises 5.40 per cent. On every basket tested, and on both the calendar and financial year, the last twelve months went up.
One point of corroboration is worth noting, because it is what makes the comparison meaningful rather than a quarrel between two different definitions. Confindustria reported $1.7 billion for calendar 2024. The four-code basket gives $1,721.94 million for the adjacent Indian financial year — within 1.3 per cent. The two sides appear to be measuring close to the same thing.
The aggregate did not tell the interesting story. What moved underneath it did.
A customer was lost and replaced
India’s largest market for worked stone is the United States, and in 2025 it bought $47.03 million less than the year before — a fall of 14.65 per cent. That is consistent with the tariff pressure on stone entering the American market that the European trade press has covered at length.
What has not been covered is where the volume went. Vietnam rose $36.75 million, the United Kingdom $13.84 million, and Poland $12.68 million. Those three alone added $63.27 million against $47.03 million lost. The United Arab Emirates, Turkey and Italy each grew as well.
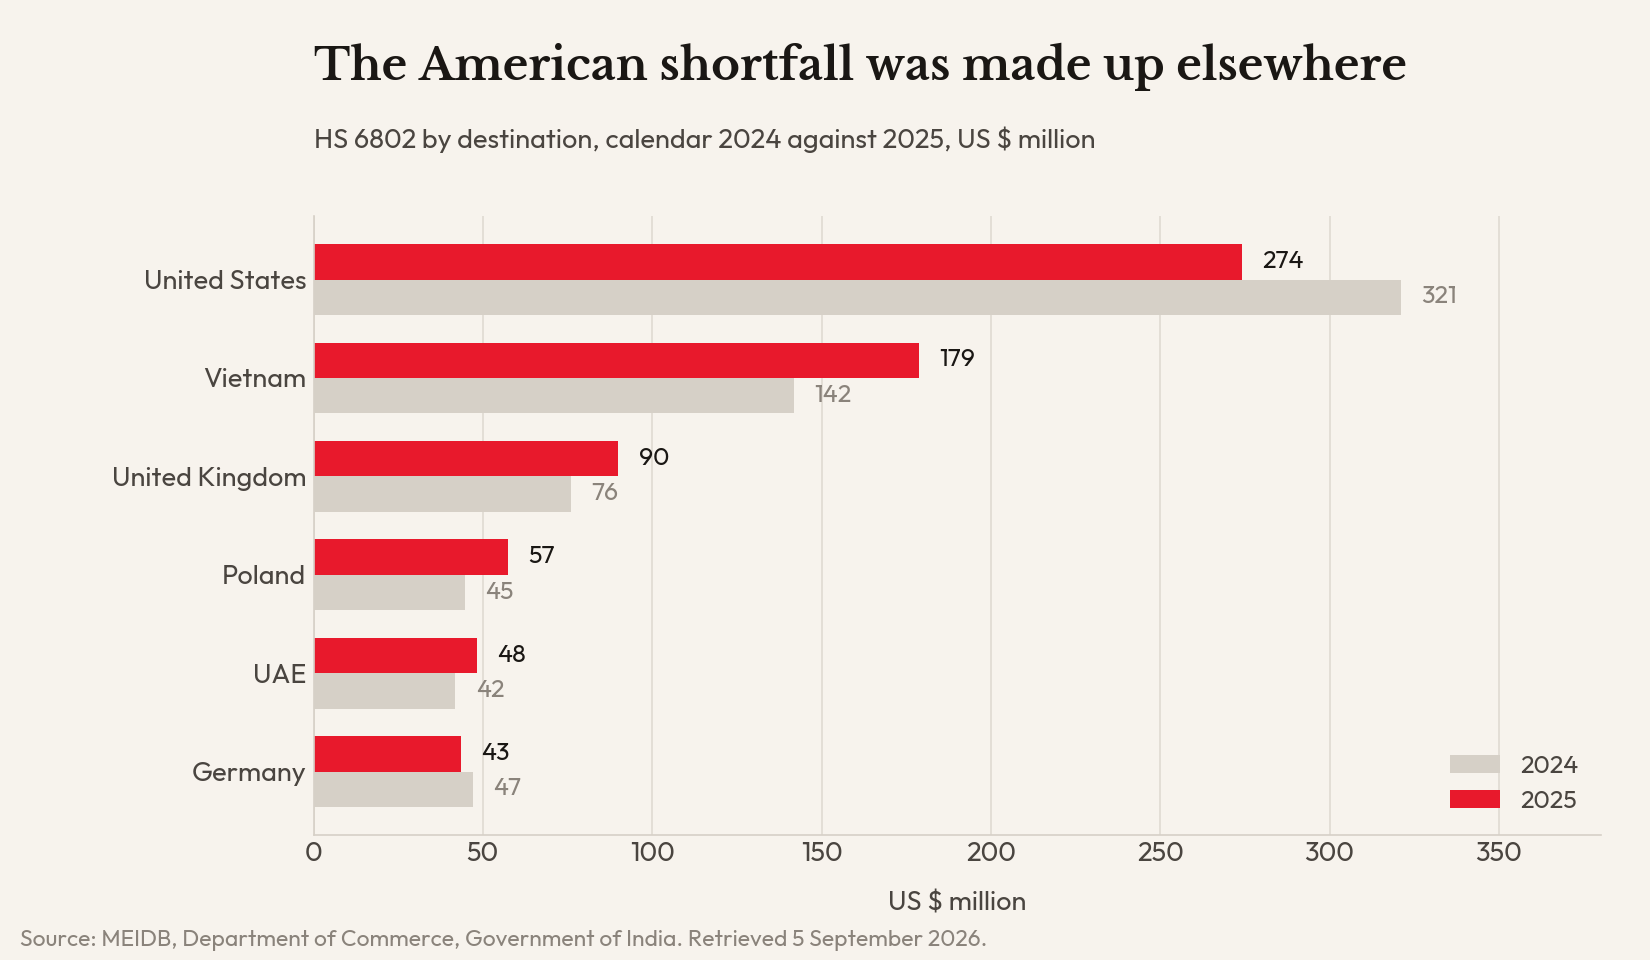
A sector losing its largest customer and replacing the value within twelve months is not the same thing as a sector in its fourth year of decline. It is a sector being restructured, and the two call for very different commercial responses from anyone selling into it.
The equipment side agrees
Indian imports of stone-working machinery, HS 8464, tell a matching story. Imports from Italy went from $17.07 million in 2024-25 to $51.80 million in 2025-26. Confindustria reported a rise of 103.3 per cent to $41.6 million on the calendar year; the Indian figure is larger because the financial year captures more of the ramp. Both describe the same event.
The headline percentage flatters it, though. Italian machinery imports had fallen for three straight years, from $46.34 million in 2022-23 to $17.07 million in 2024-25. Measured against the earlier peak rather than the trough, 2025-26 is up 11.8 per cent, not 203 per cent. And India’s total machinery imports from all sources, at $187.80 million, remain 38 per cent below their 2021-22 level.
The number that is not a base effect is share. Italy took 27.58 per cent of India’s stone-machinery imports in 2025-26, against 12.69 per cent the year before and a previous high of 23.50 per cent. Over the same period Italy’s share of India’s raw marble imports fell from 20.69 per cent to 15.93 per cent. Italy is selling India proportionally fewer blocks and considerably more machines.
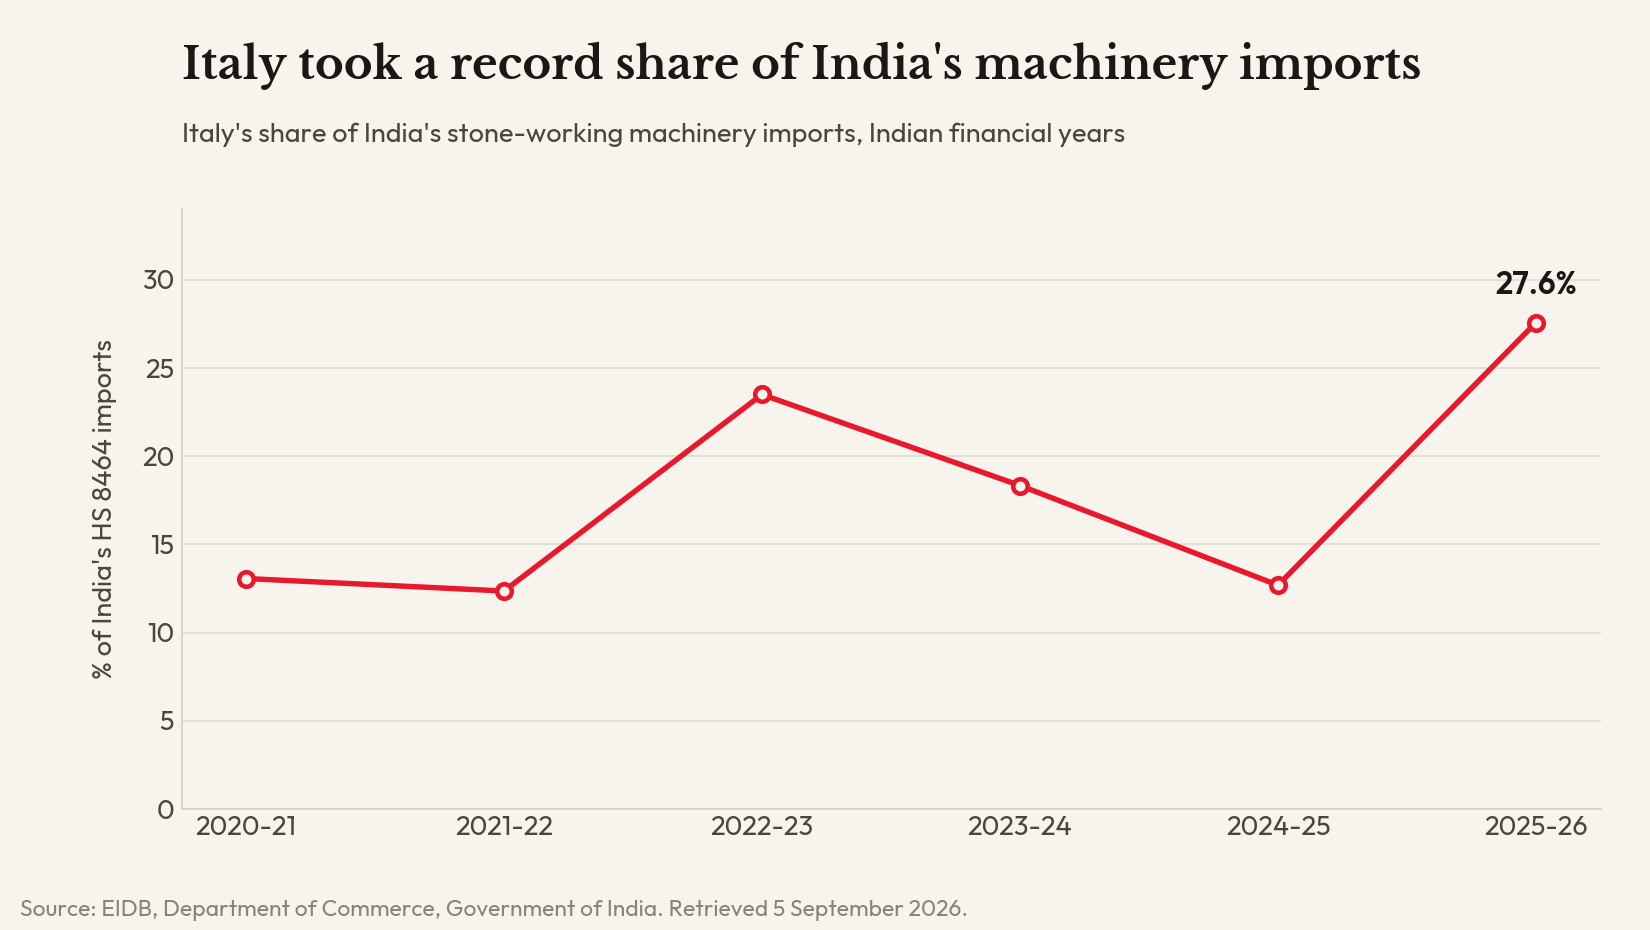
Set against a raw marble market where Turkey supplies 52 per cent and slipped 2.45 per cent in a year that grew 3.90 per cent, Italy was the only major supplier gaining ground on both fronts at once. No published source explains why.
What this is worth to a supplier
A manufacturer deciding whether to commit sales effort to India in the coming year would reach one conclusion from a fourth year of decline and a different one from a sector that has just replaced its largest customer and is re-equipping. The first says wait. The second says the buying decisions are being made now.
Sol Gravitas takes no position on which reading is right about the future. The figures above describe what has already happened, and they are reproducible by anyone with a browser in about twenty minutes.
Limitations
A finding was dropped. An earlier line of this analysis concerned quartzite, HS 2506, where EIDB shows exports to China falling from $209.71 million in 2023-24 to $46.45 million in 2024-25. MEIDB, on a calendar basis, shows China buying $15.28 million in 2023 and $112.51 million in 2024. Since April 2023 to March 2024 falls entirely inside those two calendar years, the EIDB figure exceeds the arithmetic ceiling of the MEIDB series. The two official databases cannot both be right, and nothing here rests on that code.
Databases differ. EIDB and MEIDB have different revision cycles, so figures for the same period may not agree exactly. Where both were available the calendar-basis MEIDB figure has been used for headline claims and the source is named at each chart.
Basket definition. No HS codes are given for the aggregate in the article. The 1.3 per cent match on 2024 suggests a close overlap with the four-code basket used here but does not establish it.
Secondary source. The projection is cited from Marmo Macchine International, 18 April 2026. The Studies Centre’s own publication was not available and has not been reviewed. Any difference between the two is not accounted for here.
Country of origin is not a supplier map. The United Arab Emirates is the third-largest recorded supplier of raw marble to India at $27.95 million, a stone it does not meaningfully quarry. Customs origin data reflects the shipping route as much as the source.
Machinery scope. HS 8464 covers machine tools for ceramics, concrete and cold-working glass alongside stone. It is not a pure stone-machinery figure.
Sol Gravitas will publish any correction Confindustria Marmomacchine, Marmo Macchine International or any other party provides, in full and without editing. Corrections and queries: info@solgravitas.com