Udaipur and Rajsamand are known for marble. The government’s own One District One Product list names marble and granite products as the product of both districts (ODOP Product List, version 32, 19 August 2025).
Sol Gravitas’s first stone study used official trade data at country level and found that India’s stone exports did not fall in 2025. This study uses the DGCI&S data behind those national statistics, one level down: what each district declares it exports, product by product, as written on the shipping bills.
Over three years, that record shows the two districts’ stone exports shifting away from finished product and towards stone shipped before it is polished or worked.
How this was checked
- Source
- Directorate General of Commercial Intelligence and Statistics (DGCI&S), Ministry of Commerce and Industry, Foreign Trade Data Dissemination Portal, report type “Export by State by District of Origin”. Records purchased through the portal’s guest login at Rs 1 per record.
- Codes
- Unworked stone: HS headings 2514 to 2517 (slate; marble; granite; crushed stone), of which 2514 to 2516 cover stone that is rough, roughly trimmed or merely cut into rectangular blocks or slabs, and 2517 covers crushed stone, gravel, chippings and powder.
Worked stone: headings 6801 to 6803 (setts and kerbstones; worked monumental and building stone; worked slate), which cover stone worked beyond sawn blocks and slabs (dressed, polished, shaped or carved), and also some coloured chippings and powder. Worked monumental and building stone, heading 6802, is about 99 per cent of this group in the belt. Together these are natural stone.
Artificial stone: heading 6810 (articles of cement, concrete or artificial stone). - Query path
- Export by District of Origin, by commodity, Rajasthan, Udaipur and Rajsamand, at 4-digit level, and at 8-digit level for heading 6810. District totals from the portal’s all-commodity district report.
- Retrieved
- 13 and 14 October 2026. Fourteen purchases, 655 records, covering April 2023 to March 2026. The portal allows at most twelve months per query, so each year was bought separately.
- Comparison
- Three financial years, 2023-24 to 2025-26.
Internal checks: for 2024-25 the stone headings in the stone file match the same headings in Udaipur’s full 601-heading file to the rupee, and Udaipur’s district total matches the sum of those 601 headings. For 2023-24 the 8-digit lines of heading 6810 add up to the 4-digit figure to the rupee in both districts.
More block, less finished stone
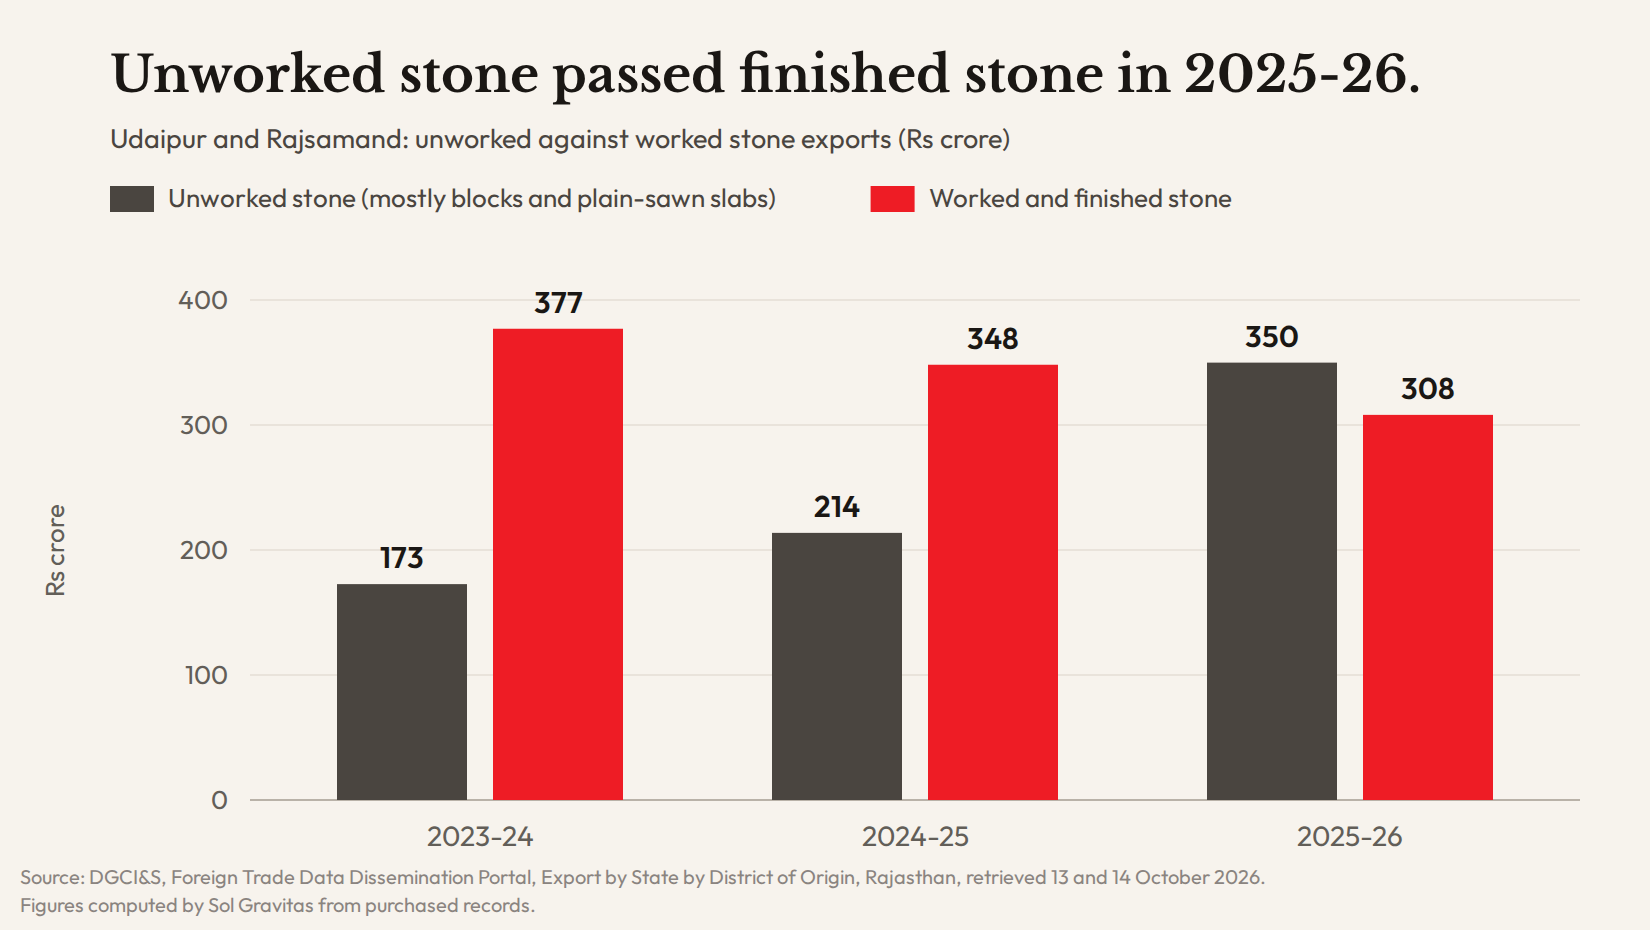
Across the two districts, worked and finished stone exports fell year on year: Rs 377 crore, then Rs 348 crore, then Rs 308 crore, down 18 per cent in two years. Unworked stone rose year on year: Rs 173 crore, then Rs 214 crore, then Rs 350 crore, roughly doubling. In 2025-26 unworked stone overtook worked stone for the first time in these three years.
Udaipur drives the change. Its worked stone fell from Rs 341 crore to Rs 278 crore over the two years, while its unworked stone rose from Rs 154 crore to Rs 323 crore. Its exports of marble and of granite in block and plain-slab form each more than doubled in rupee terms. In Rajsamand, worked stone fell 17 per cent over the two years, from Rs 36 crore to Rs 30 crore. Rajsamand on its own still exports more worked stone than unworked: in 2025-26, Rs 30 crore against Rs 26 crore. The overtaking is a belt-wide figure, driven by Udaipur.
How to read this chart
Each pair of bars is one year. The red bar, finished stone, gets shorter every year. The grey bar, unworked stone, mostly block and plain slab, gets taller every year. In 2025-26 the grey bar passes the red one: for the first time in these three years, the belt’s unworked stone exports were worth more than its finished stone exports. The dollar values move the same way, and the dollar fall in finished stone is steeper, 23 per cent over the two years.
Artificial stone rose, then fell back
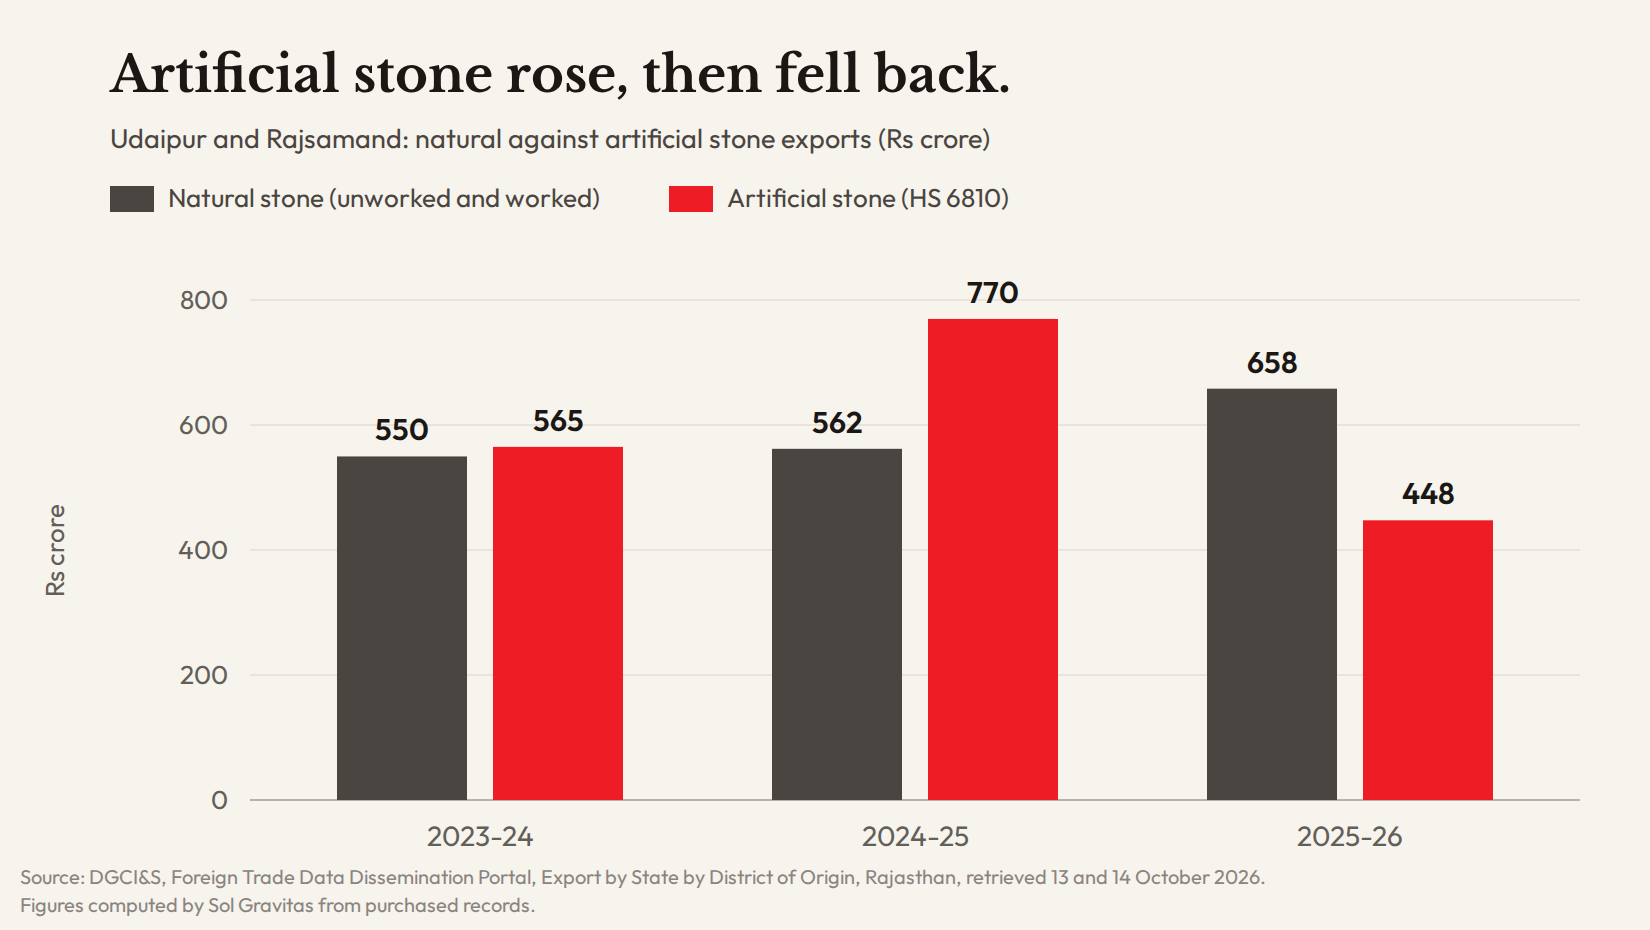
Heading 6810, artificial stone and cement or concrete articles, moved differently. Across the two districts it was Rs 565 crore in 2023-24, rose 36 per cent to Rs 770 crore in 2024-25, then fell 42 per cent to Rs 448 crore in 2025-26. In 2023-24 and 2024-25 it was larger than all natural stone combined. In 2025-26 natural stone moved ahead, at Rs 658 crore.
The fall came in both districts: Udaipur from Rs 646 crore to Rs 374 crore, Rajsamand from Rs 124 crore to Rs 74 crore. The record bought for this study does not show destinations, so it cannot say which markets bought less.
How to read this chart
The grey bar, natural stone, rises slightly in 2024-25 and grows in 2025-26. In dollars it was flat in 2024-25, at 66 million both years. The red bar, artificial stone, jumps in 2024-25 and drops sharply in 2025-26. Natural stone is the steadier export. Artificial stone swings from year to year, and the record does not show why.
Stone in the districts’ wider exports
Udaipur declared total exports of Rs 4,172 crore in 2023-24, Rs 4,842 crore in 2024-25 and Rs 4,952 crore in 2025-26. Rajsamand declared Rs 641 crore, Rs 749 crore and Rs 1,491 crore. Rajsamand’s total roughly doubled in the latest year, and stone was not the reason: its natural and artificial stone together fell over that year. The products behind the jump are outside this study.
Natural and artificial stone together made up 23 per cent of the two districts’ declared exports in 2023-24, 24 per cent in 2024-25 and 17 per cent in 2025-26. The fall in the latest year came because stone exports fell, from Rs 1,332 crore to Rs 1,106 crore, while the districts’ other exports grew.
What this means for a unit in the belt
District figures are not something most units look at. But the record shows three things worth a unit’s attention.
A larger share of export value is leaving before the stone is finished. Over two years, the belt’s finished stone exports fell 18 per cent while its block and plain-slab exports roughly doubled. When stone is exported before polishing and finishing, that work, and the wages that come with it, happen outside India.
Artificial stone is not a steady market. It rose by more than a third in one year and fell by more than two-fifths the next. A unit thinking of moving into it should know that the export record shows sharp swings, not steady growth.
The district on the shipping bill decides which district gets counted. These figures are what exporters declare. A unit in Rajsamand that writes Udaipur on its shipping bills adds to Udaipur’s figures, not Rajsamand’s, and district-wise export figures are what government district export planning can draw on.
What a unit can ask Sol Gravitas
This study looks at whole districts. A unit’s own questions are narrower, and the same government records, together with conversations in the trade, can answer most of them. These are questions Sol Gravitas takes on.
What does my product actually sell for abroad, country by country, and is my price above or below the district’s? At the 8-digit level the export record carries quantity as well as value, so a price per unit of quantity can be worked out product by product, and DGCI&S also publishes district figures by destination country.
Which countries are buying more of what I make, and which are buying less? DGCI&S publishes each district’s exports by destination country, product by product.
Why did artificial stone exports fall in 2025-26, and which markets stopped buying?
Who else in India exports what I export, and are they growing faster than this district?
Each answer comes as a short written report in plain language, with every number traced to its source and its limits stated, and a summary in Hindi on request. Scope and cost are agreed in writing before any work starts. To ask a question about your own unit, write to info@solgravitas.com.
A short owner’s brief of this study is available to download from Resources.
Limitations
Self-declared district. DGCI&S compiles district-wise export data from the district code the exporter reports in the shipping bill, and states that it does not validate those codes. Its separate note on state-of-origin data adds that exporters tend to report the state they belong to, the state of the port, or the state they bought from, rather than where the goods were produced; that a shipping bill carries only one origin code even when its items come from several places; and that many bills leave the code blank. The same reporting issues are likely to apply to district codes. DGCI&S notes the problem is worst for exporters who do not manufacture, such as merchant exporters, who know where they bought goods rather than where they were produced. The figures describe where exporters say goods originated, not where quarries or yards are. “The record shows” is the verb used throughout this study.
What “unworked” means. Headings 2514 to 2516 include stone merely cut, by sawing or otherwise, into rectangular blocks or slabs, and 2517 includes crushed stone and marble chippings and powder. Some sawing may therefore happen in the district before stone counted here as unworked is shipped. Stone worked beyond that, dressed, polished, shaped or carved, falls under 6801 to 6803. All figures are values; the stone files bought for this study carry no quantity, so the study does not say how many tonnes moved.
Heading 6810 is broad. It covers articles of cement and concrete as well as artificial stone, and the 8-digit lines bought for this study are mostly residual “other” categories that do not separate them. This study calls the heading artificial stone and does not claim more about its contents.
Three years, latest year provisional. Each year is a separate purchase. This study covers April 2023 to March 2026. The most recent year may still be revised by DGCI&S. Earlier years exist on the portal from April 2021.
District boundaries. The portal lists 33 Rajasthan districts, the set that existed before the state’s 2023 reorganisation. Districts created since, such as Salumber, carved out of Udaipur, do not appear separately. If any exporters in those areas now report a new district code, their exports would not appear under Udaipur; these files cannot show whether that happens.
Single source. Sol Gravitas found no independent second source for district-level exports; other published district figures, such as those on the Department of Commerce’s NIRYAT portal, derive from the same DGCI&S record. The cross-checks are internal to the record and are listed under How this was checked.
Data re-use. The underlying records were purchased from DGCI&S and are held by Sol Gravitas. This page publishes computed totals, groups and changes only, cites DGCI&S as the source with the retrieval dates, and reproduces no purchased records.
Corrections are welcome at info@solgravitas.com.