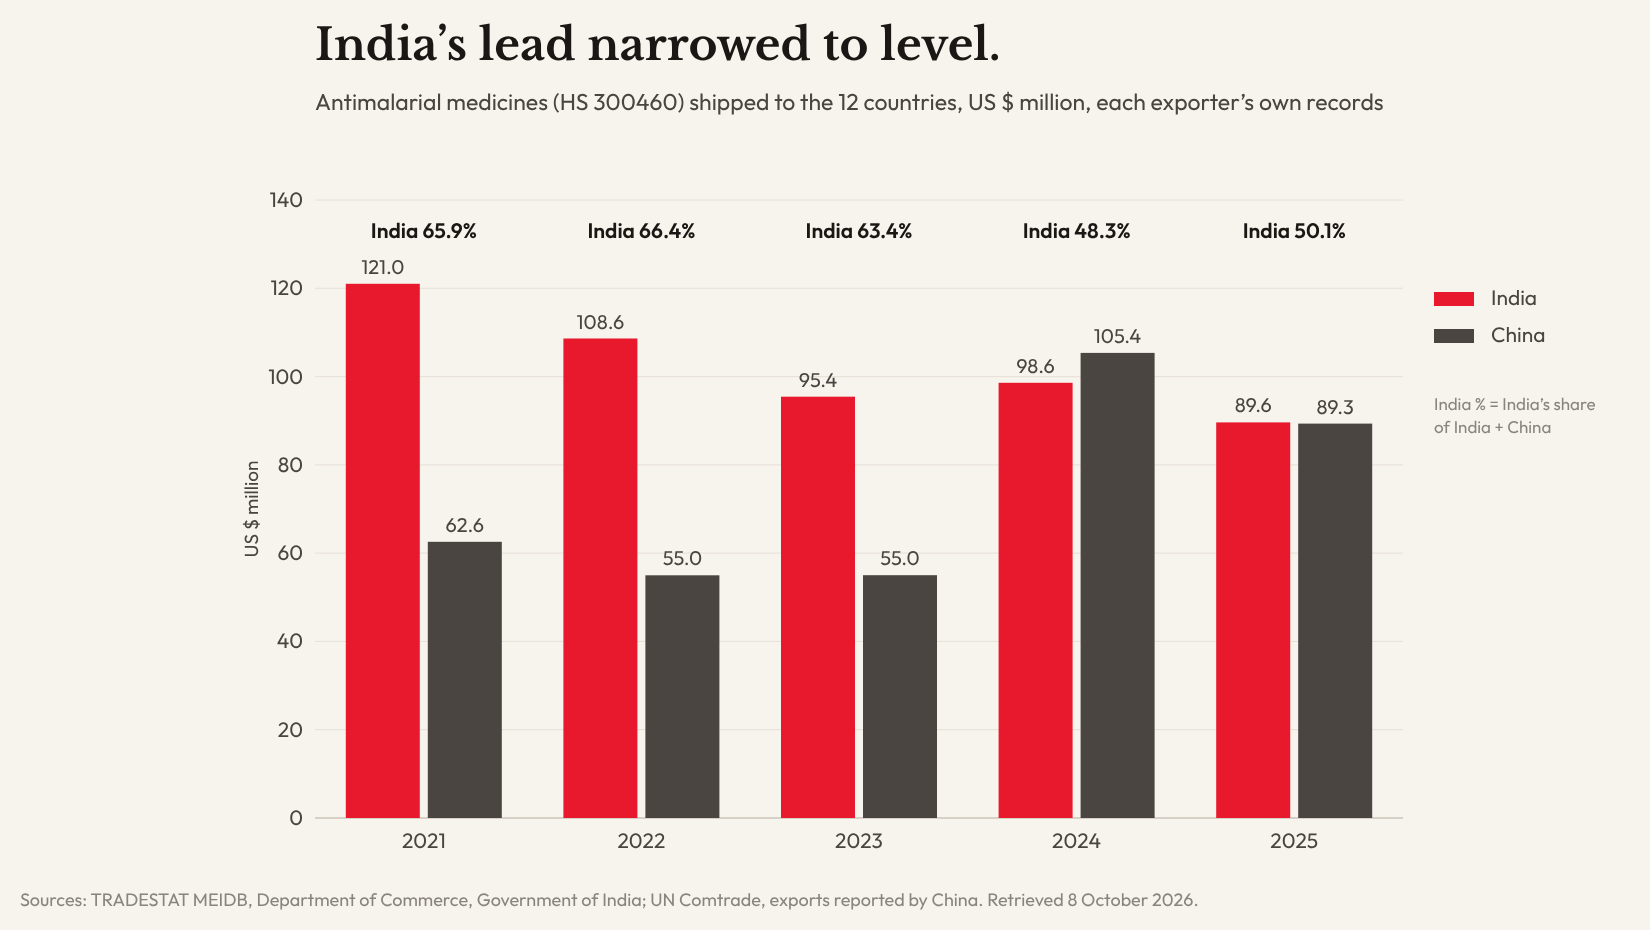
Between 2021 and 2025, the balance in the trade records moved towards China. By each country’s own export records, India shipped $121.0 million of these medicines to the 12 countries in 2021 and China $62.6 million. By 2025 the two were level, at $89.6 million and $89.3 million. The importing countries’ own records agree on the direction but not the size: in the eight countries with import records every year from 2022 to 2025, India’s share fell from 72 per cent in 2022 to 64 per cent in 2025.
Sol Gravitas checked three separate records against each other: what the exporting countries say they shipped, what the importing countries say they received, and what the Global Fund says it bought and which maker made it. Where the records agree, the finding is stated. Where they disagree, both are shown.
How this was checked
- The question
- In Africa’s biggest malaria markets, who supplies antimalarial medicines, India or China, and is that changing?
- Countries
- The 12 African countries that together carry 75.7 per cent of the WHO African Region’s estimated malaria cases in 2024: Nigeria, DR Congo, Uganda, Ethiopia, Mozambique, Angola, Tanzania, Côte d’Ivoire, Mali, Burkina Faso, Niger and Madagascar. Kenya is added as an extra case because India’s and Kenya’s records of trade between them differ so widely. Source: World Health Organization, World Malaria Report 2025, Annex 4H.
- Exporters
- Department of Commerce, Government of India: TRADESTAT, MEIDB, for India’s exports. UN Comtrade, for China’s exports as reported by China.
- Importers
- UN Comtrade: each of the 13 countries’ own import records, and Kenya’s re-exports.
- Makers
- The Global Fund, Price & Quality Reporting (PQR), transaction summary for anti-malaria medicines, one download per country. The Global Fund, List of Pharmaceutical Products (Malaria), version 132 of 30 September 2026, for the country of each approved manufacturing site.
- Code
- HS 300460: medicines containing antimalarial active ingredients, put up in measured doses or retail packs.
- Query path
- TRADESTAT: Export → Commodity-wise all Countries, calendar year, values in US$ million and quantity in kilograms. UN Comtrade: Goods, Annual, HS, by reporting country and partner, imports, exports and re-exports. Global Fund PQR: Transaction Summary, product category “Anti-malaria medicine”, one country at a time.
- Retrieved
- 8 October 2026. The TRADESTAT report is dated 8 October 2026, with 2024 and 2025 marked revised final.
- Checks
- Every figure was computed by script from the downloaded files, with no retyping. A separate check, which never saw the first calculation, recomputed 112 figures from the same files and found no differences. Ten key figures and facts were then read again by hand from the live sources, and 10 of 10 matched.
The trade records: from nearly two to one, to level
India’s export records and China’s export records both cover HS 300460. India’s lead narrowed after 2022. In 2024 China shipped more, $105.4 million against $98.6 million, and in 2025 the two were within $0.3 million of each other. China sent more than India to one of the 12 countries in 2021 and to six of them in 2025.
| Year | India’s record of exports | China’s record of exports | India’s share, value | India’s share, weight | Countries where China sent more |
|---|---|---|---|---|---|
| 2021 | $121.02m | $62.58m | 65.9% | 59.1% | 1 of 12 |
| 2022 | $108.62m | $54.99m | 66.4% | 65.2% | 4 of 12 |
| 2023 | $95.43m | $55.00m | 63.4% | 59.3% | 4 of 12 |
| 2024 | $98.60m | $105.36m | 48.3% | 50.3% | 5 of 12 |
| 2025 | $89.61m | $89.35m | 50.1% | 54.5% | 6 of 12 |
Exports of HS 300460 to the 12 countries combined. Shares are India ÷ (India + China). Sources: TRADESTAT MEIDB, Department of Commerce, Government of India; UN Comtrade, exports reported by China. Retrieved 8 October 2026.
By weight India still leads, with 54.5 per cent of the kilograms shipped in 2025. These 12 markets matter more to China than to India: they took 63.6 per cent of China’s exports of these medicines in 2025, against 48.4 per cent of India’s. India’s exports to all countries fell from $223.7 million in 2021 to $185.1 million in 2025, while China’s rose from $113.9 million to $140.5 million.
The importers’ records agree on the direction, not the size
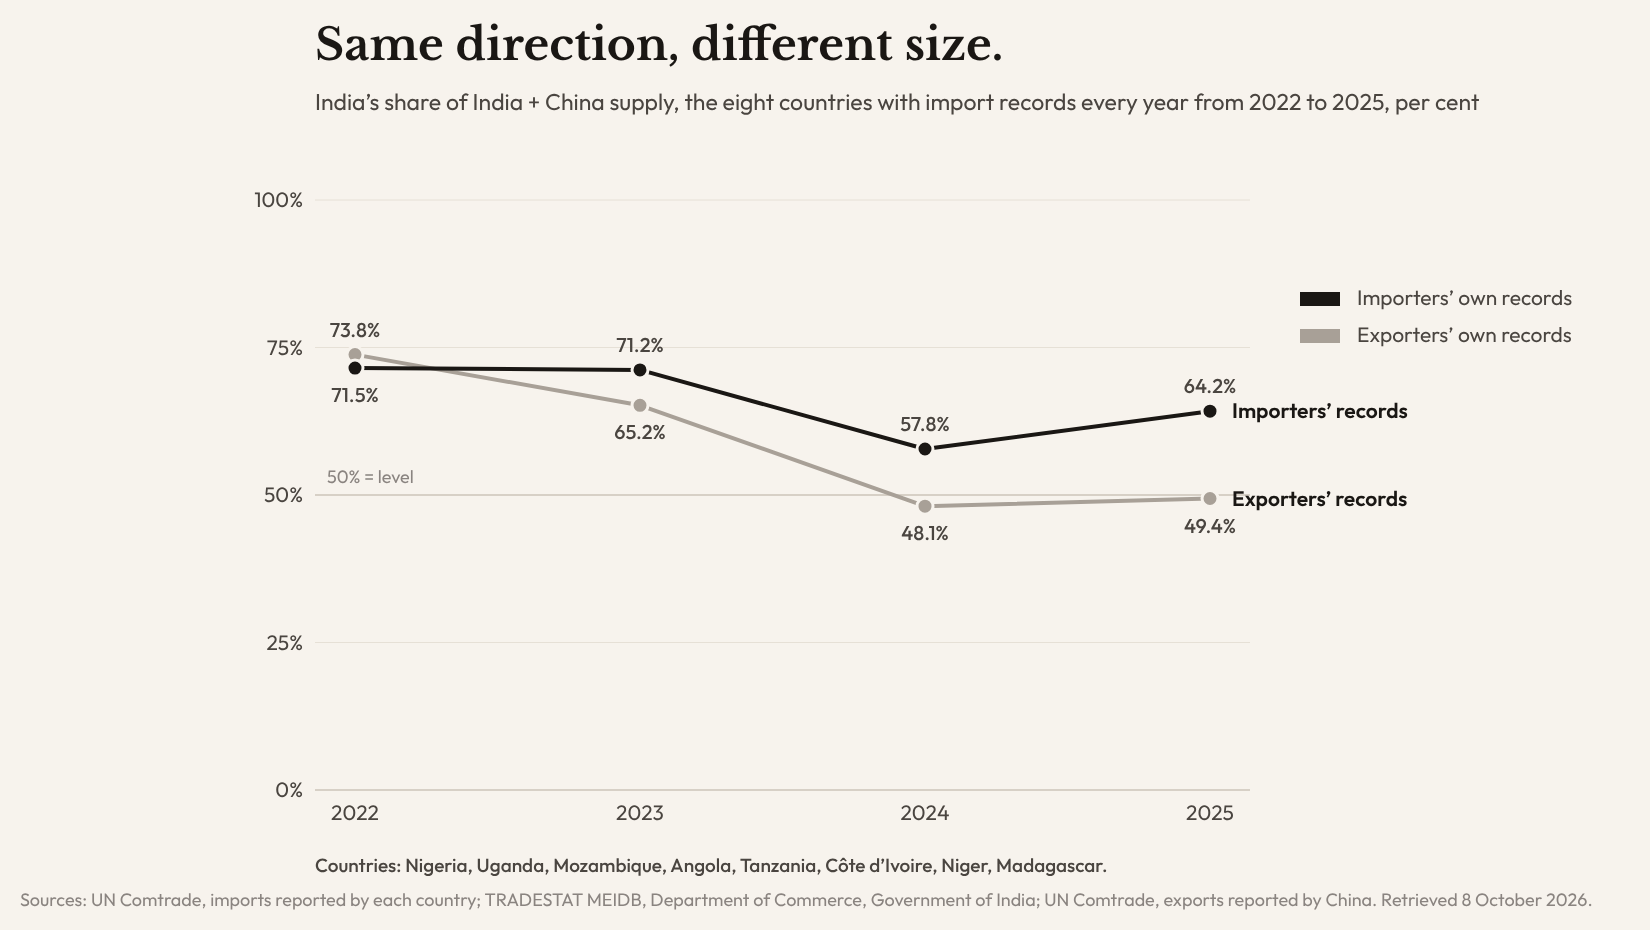
An exporter records where goods are sent. An importer records where goods were made. For the eight countries with import records in every year from 2022 to 2025 (Nigeria, Uganda, Mozambique, Angola, Tanzania, Côte d’Ivoire, Niger and Madagascar), the importers’ own records show India’s share of India-plus-China supply falling from 71.5 per cent to 64.2 per cent. Imports from China in those records rose from $18.9 million to $34.3 million. For the same eight countries, the exporters’ records show a much steeper fall, from 73.8 per cent to 49.4 per cent.
| Year | Importers’ record of imports from India | Importers’ record of imports from China | India’s share, importers’ records | India’s share, exporters’ records |
|---|---|---|---|---|
| 2022 | $47.33m | $18.85m | 71.5% | 73.8% |
| 2023 | $44.39m | $17.95m | 71.2% | 65.2% |
| 2024 | $56.26m | $41.12m | 57.8% | 48.1% |
| 2025 | $61.60m | $34.34m | 64.2% | 49.4% |
The eight countries with import records in every year from 2022 to 2025: Nigeria, Uganda, Mozambique, Angola, Tanzania, Côte d’Ivoire, Niger and Madagascar. Sources: UN Comtrade, imports reported by each country; TRADESTAT MEIDB; UN Comtrade, exports reported by China. Retrieved 8 October 2026.
Across all 50 country-years with import records for the 12 countries, the two sides agree on which supplier was larger in 40. One possible reason for the gap is routing: India also exported $34.5 million of these medicines to France in 2025. If part of that reaches Africa, an African importer would record it as Indian while India’s records show it going to France. This study has not tested how much does.
In Global Fund purchases, China made most of the SPAQ co-blister and injectable artesunate. Factories in India made most of the artemether-lumefantrine.
Who makes what: the split is by product
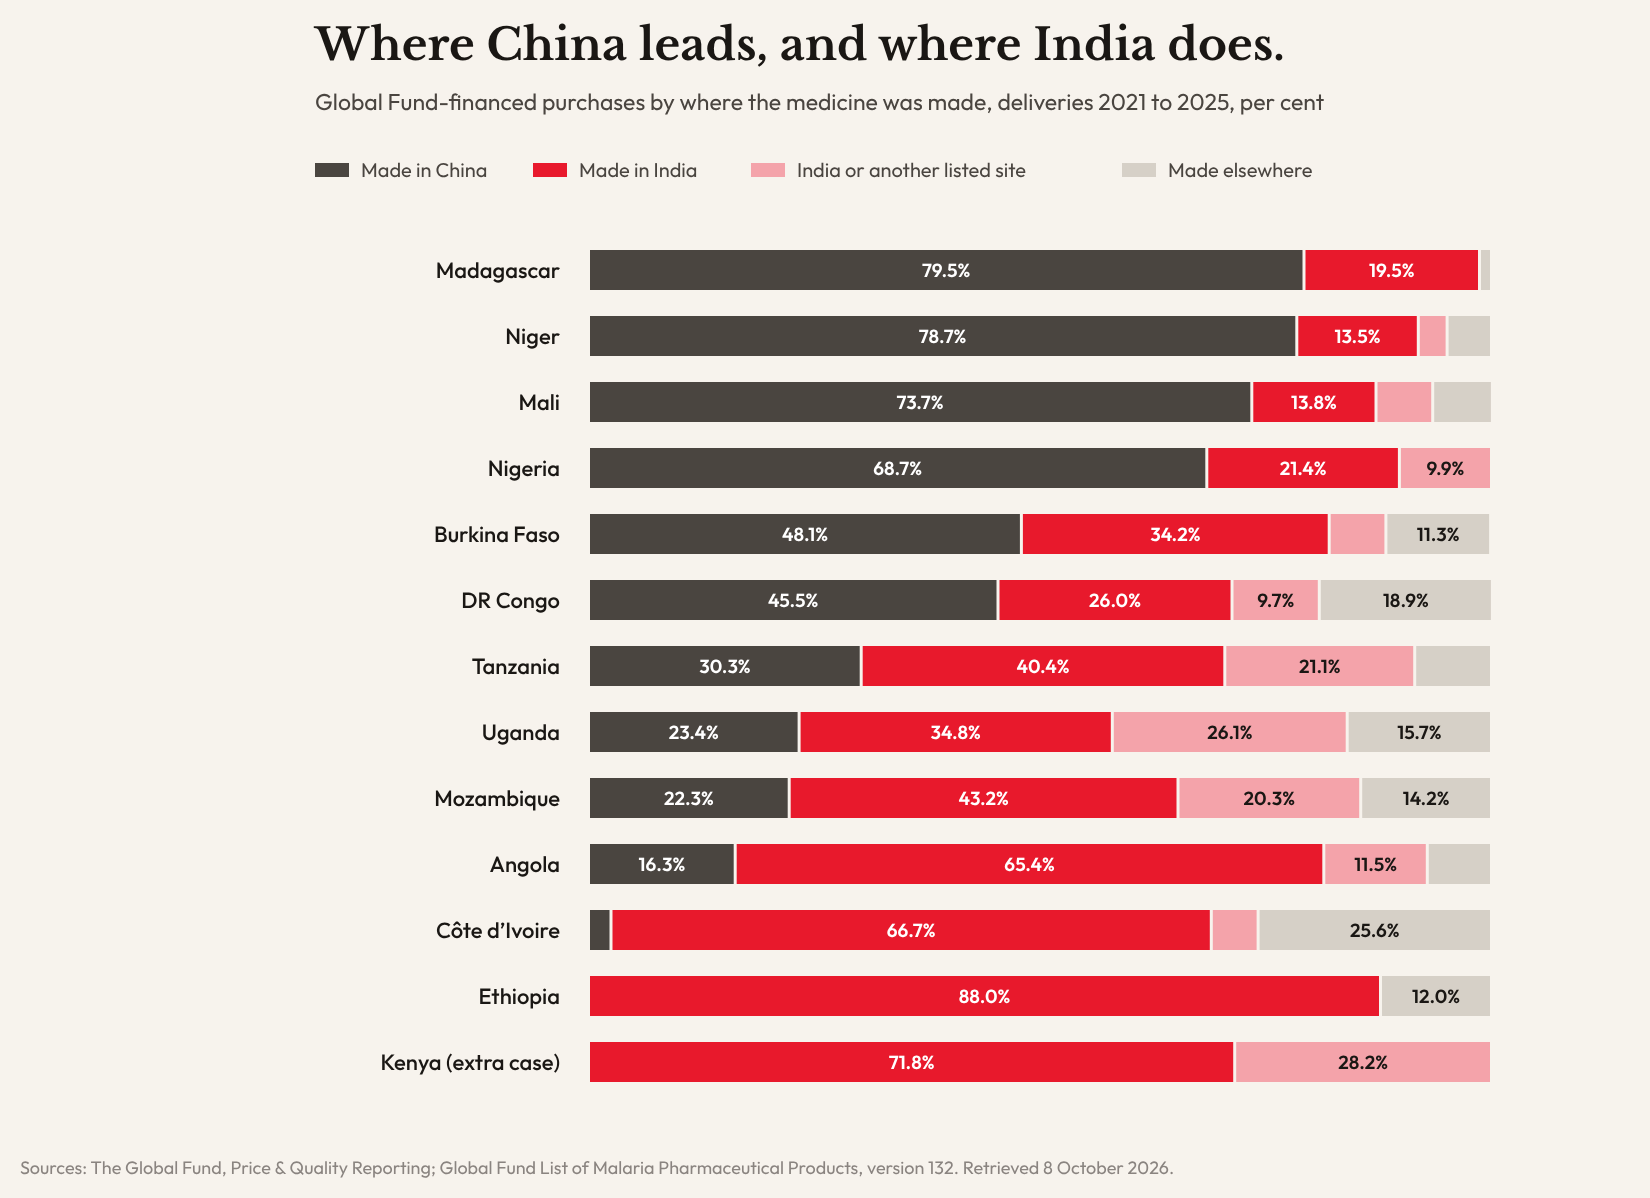
Global Fund records name the maker of each purchase they list. Across the 13 countries, deliveries from 2021 to 2025 came to $442.7 million. Each maker was matched to its factory country using the Global Fund’s own list of approved manufacturing sites. 45.6 per cent was made in China, all of it by one company, Guilin Pharmaceutical (Fosun Pharma). Between 31.2 per cent and 44.4 per cent was made in India. The range exists because three makers’ artemether-lumefantrine products list factories both in India and in Kenya, Uganda or Zambia.
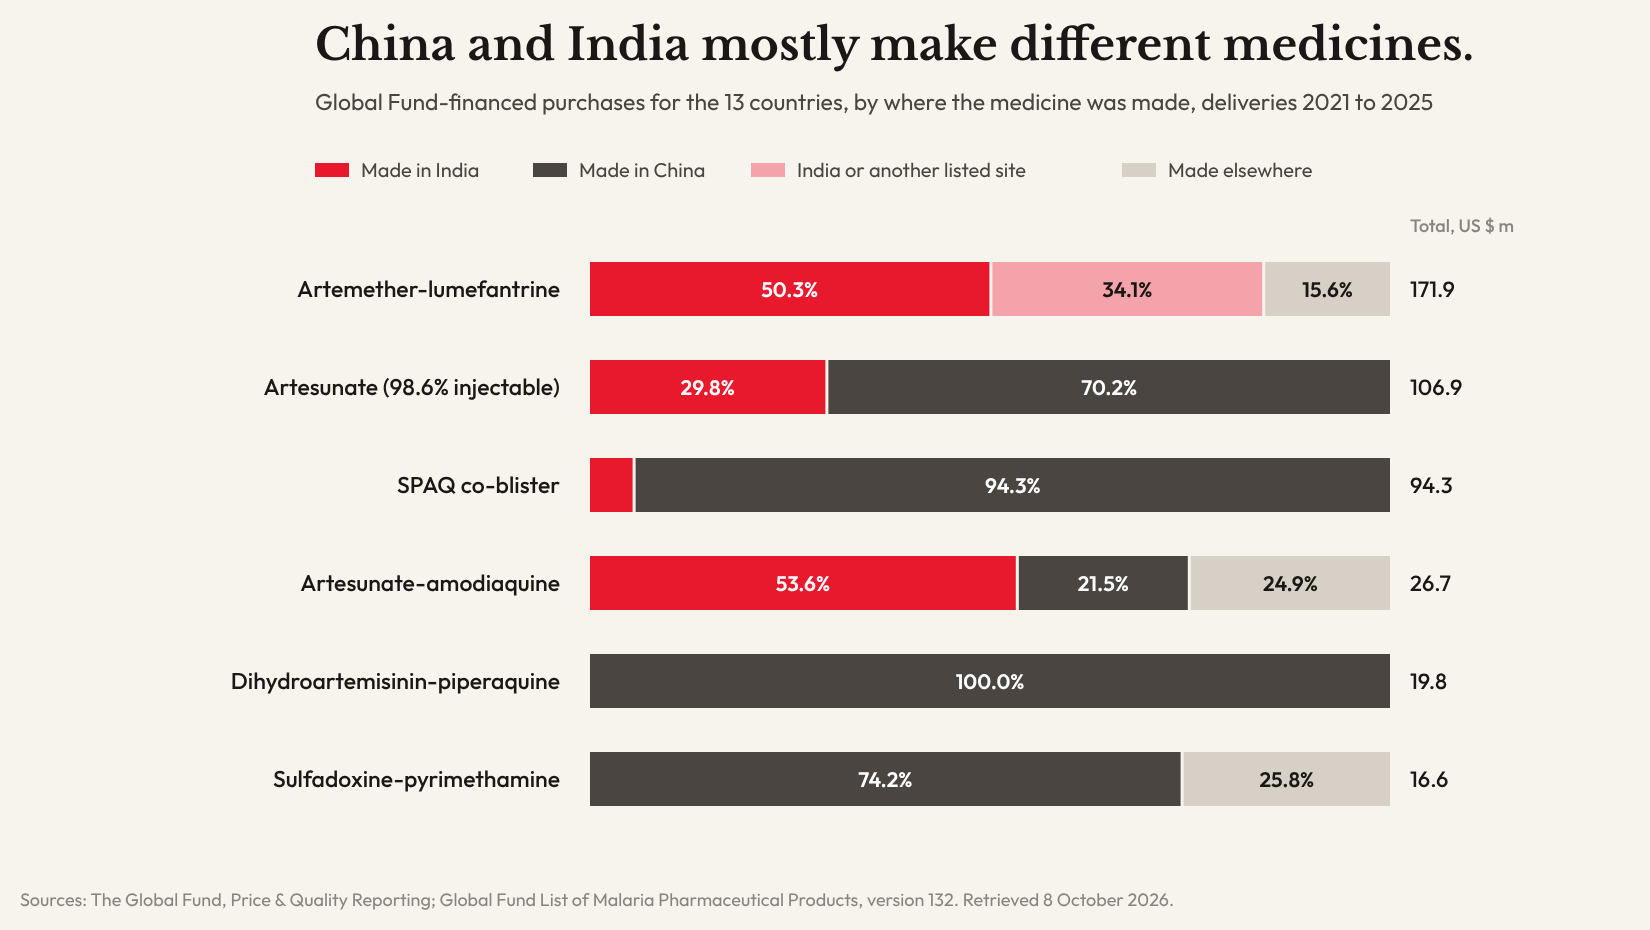
China made 94.3 per cent of the SPAQ co-blister, 71.3 per cent of injectable artesunate and all of the dihydroartemisinin-piperaquine. Factories in India made at least 50.3 per cent of artemether-lumefantrine, the largest single product at $171.9 million. No maker with only Chinese factories supplied it.
Country by country
China leads where Global Fund purchases are mostly SPAQ and artesunate. In Niger those two products were 80.0 per cent of purchases, and 78.7 per cent of purchases were made in China. In Mali the figures are 73.7 per cent and 73.7 per cent; in Nigeria, 68.6 per cent and 68.7 per cent. India leads where those two products are a small part of purchases: Ethiopia (none, with 88.0 per cent made in India), Côte d’Ivoire (7.8 per cent, with 66.7 per cent) and Kenya (11.0 per cent, with 71.8 per cent). There are two exceptions. In DR Congo those two products were 33.5 per cent of purchases, yet 45.5 per cent of purchases were made in China. In Madagascar, 37.3 per cent of purchases were dihydroartemisinin-piperaquine, all of it made in China.
| Country | WHO rank | Exporters’ records, 2021 | Exporters’ records, 2025 | Importer’s own records | Global Fund: made in China | Global Fund: made in India |
|---|---|---|---|---|---|---|
| Nigeria | 1 | 64.9% | 47.3% | 57.1% (2025) | 68.7% | 21.4% |
| DR Congo | 2 | 58.9% | 42.8% | 49.1% (2024) | 45.5% | 26.0% |
| Uganda | 3 | 84.0% | 31.3% | 54.8% (2025) | 23.4% | 34.8% |
| Ethiopia | 4 | 70.3% | 81.1% | 12.1% (2023) | 0.0% | 88.0% |
| Mozambique | 5 | 85.3% | 74.3% | 62.4% (2025) | 22.3% | 43.2% |
| Angola | 6 | 56.0% | 58.0% | 74.6% (2025) | 16.3% | 65.4% |
| Tanzania | 7 | 71.5% | 59.2% | 73.1% (2025) | 30.3% | 40.4% |
| Côte d’Ivoire | 8 | 70.5% | 76.7% | 78.1% (2025) | 2.5% | 66.7% |
| Mali | 9 | 58.1% | 27.3% | 55.0% (2023) | 73.7% | 13.8% |
| Burkina Faso | 10 | 56.2% | 48.0% | 48.3% (2024) | 48.1% | 34.2% |
| Niger | 11 | 44.3% | 0.2% | 30.0% (2025) | 78.7% | 13.5% |
| Madagascar | 12 | 70.8% | 83.1% | 61.2% (2025) | 79.5% | 19.5% |
| Kenya (extra case) | 20 | 79.6% | 90.1% | 73.2% (2025) | 0.0% | 71.8% |
The exporters’ and importer’s columns show India’s share of India + China supply; the importer’s column uses the latest year with records. WHO rank is by estimated malaria cases in 2024. Global Fund columns: deliveries 2021 to 2025; the rest of each country’s purchases was made at sites in India or another country, or elsewhere (see chart). Sources: WHO World Malaria Report 2025, Annex 4H; TRADESTAT MEIDB; UN Comtrade; The Global Fund. Retrieved 8 October 2026.
An open question: Kenya
India reports shipping between $13.9 million and $24.9 million a year of these medicines to Kenya from 2021 to 2025. Kenya’s customs record far less from India, and Kenya re-exports almost none. The published records do not show where the difference goes. Answering it would need Kenyan customs detail beyond what is published.
| Year | India’s record of exports to Kenya | Kenya’s record of imports from India | Kenya’s re-exports to all countries |
|---|---|---|---|
| 2021 | $13.94m | $0.48m | $0.01m |
| 2022 | $24.92m | $0.61m | $0.20m |
| 2023 | $21.38m | $0.60m | $0.03m |
| 2024 | $22.07m | $2.51m | $0.09m |
| 2025 | $20.69m | $4.17m | $0.18m |
Sources: TRADESTAT MEIDB, Department of Commerce, Government of India; UN Comtrade, Kenya’s own reports. Retrieved 8 October 2026.
Sol Gravitas takes no position on what happens next. The figures describe what has already happened, and every one can be reproduced from the official sources named.
Evidence log. Every figure in this study, with its source, the query used, the retrieval date and how it was checked.
Download the evidence log (CSV) →Data report. The same figures as tables: every number with its source and retrieval date, the method and the limits, in one PDF. What a commissioned brief looks like.
Download the data report (PDF) →Limitations
Some import records are missing. Nigeria 2021; DR Congo every year except 2024; Ethiopia and Mali after 2023; Burkina Faso 2025.
Global Fund records cover only Global Fund purchases. They cover purchases paid for with Global Fund grants. Other donors, government budgets and private pharmacies are not included. The yearly China share in these records moves up and down (39.9, 45.2, 51.5, 52.2 and 39.9 per cent for 2021 to 2025) and shows no steady trend. 2025 entries may still be incomplete.
Some Global Fund rows repeat. $6.51 million of Global Fund rows repeat another row exactly. They were kept as reported. Removing them leaves the China share at 45.6 per cent and moves the firm India share to 31.4 per cent.
One maker lists factories in three countries. Novartis artemether-lumefantrine lists factories in China, the USA and Türkiye and is counted as made elsewhere. Counting it as Chinese would raise the China share to 48.4 per cent.
Weights are not treatments. Weights mix tablets, vials and packaging, so a share by weight is not a count of treatments. Values per kilogram are not prices.
Different values. Import values usually include freight and insurance; export values usually do not.
TRADESTAT is not the official record. TRADESTAT states that its data have no legal sanctity and are for general reference only, and points to DGCI&S, Kolkata publications for official reference.
The Global Fund figures have no second public record. No other public source records these purchases by maker, so they could not be checked against a second record. They were recomputed separately from the same files, the maker-to-country mapping was rebuilt independently from the Global Fund’s list, and two of its entries were read again by hand.
No causes are stated. Where no official source explains a movement, this study says so. Routing through France is a possibility the records allow, not a finding.
This study is general information, not business, investment, legal or medical advice.
Sol Gravitas will publish any correction provided by the Department of Commerce, the UN Statistics Division, the Global Fund, the World Health Organization or any other party, in full and without editing. Corrections and queries: info@solgravitas.com